Open Access
Fig. 14.
Download original image
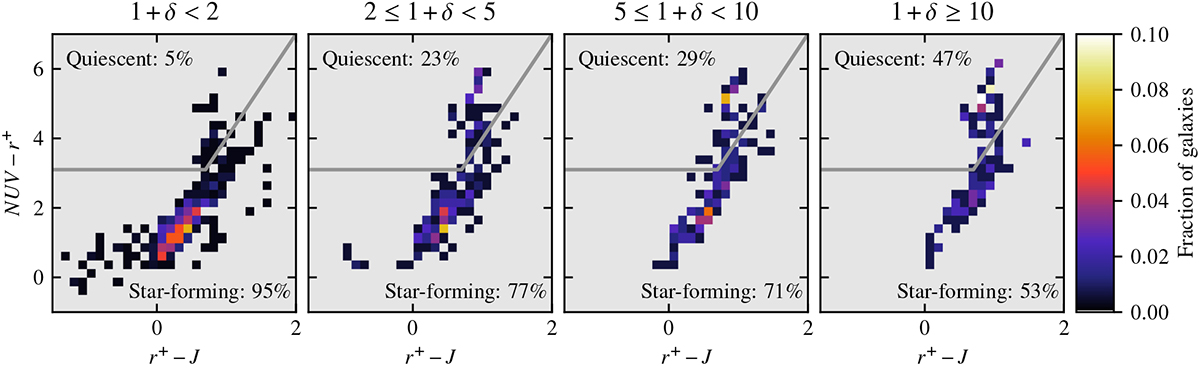
NUV − r+ vs. r+ − J histograms for the VMC overdensity classes. The gray lines show the region of the diagram used to identify quiescent galaxies. The global fraction of quiescent and star-forming galaxies is provided in each quadrant.
Current usage metrics show cumulative count of Article Views (full-text article views including HTML views, PDF and ePub downloads, according to the available data) and Abstracts Views on Vision4Press platform.
Data correspond to usage on the plateform after 2015. The current usage metrics is available 48-96 hours after online publication and is updated daily on week days.
Initial download of the metrics may take a while.