Open Access
Fig. 11.
Download original image
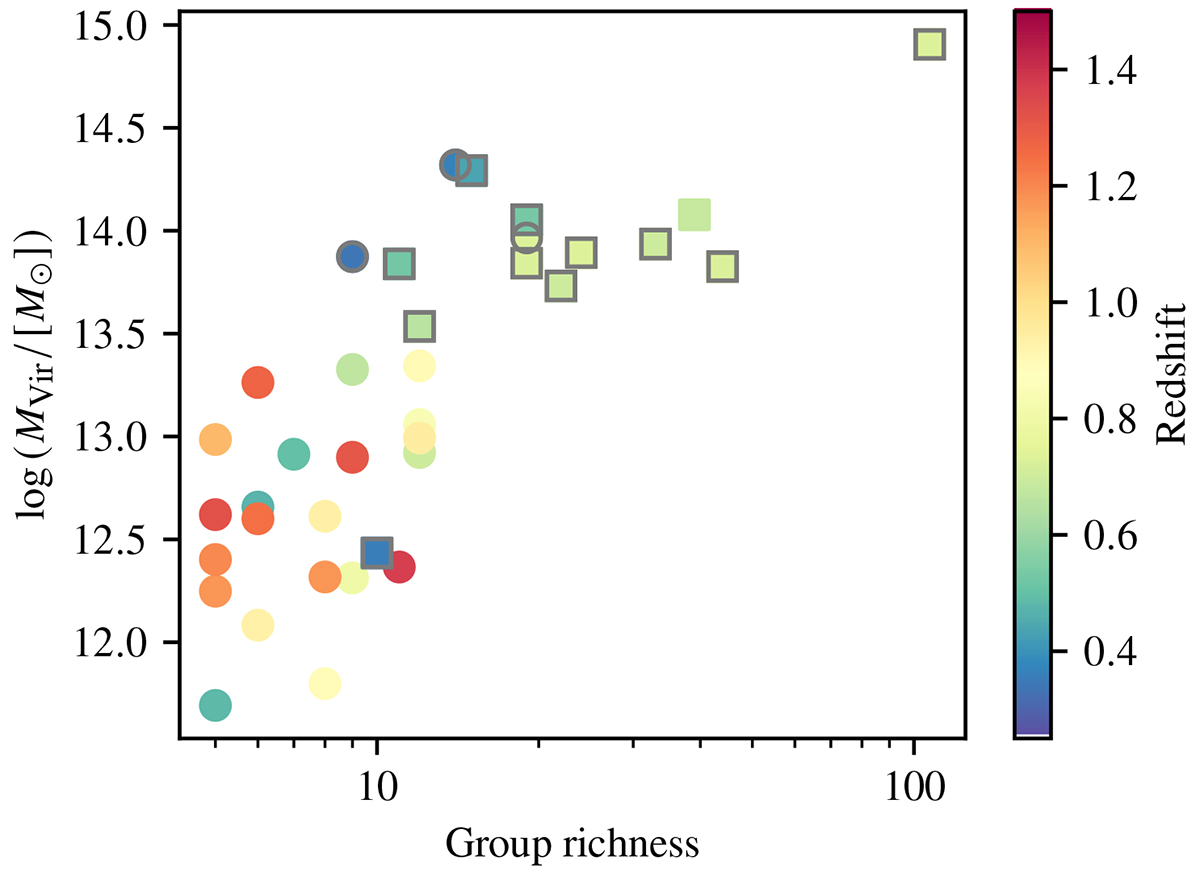
Group richness as a function of their Virial mass for groups with five or more members with 0.25 ≤ z < 1.5. Initially targeted groups have gray contours, and groups with X-ray counterparts are identified as colored squares. The color of the symbols refers to the redshift of each group.
Current usage metrics show cumulative count of Article Views (full-text article views including HTML views, PDF and ePub downloads, according to the available data) and Abstracts Views on Vision4Press platform.
Data correspond to usage on the plateform after 2015. The current usage metrics is available 48-96 hours after online publication and is updated daily on week days.
Initial download of the metrics may take a while.