Fig. A.2
Download original image
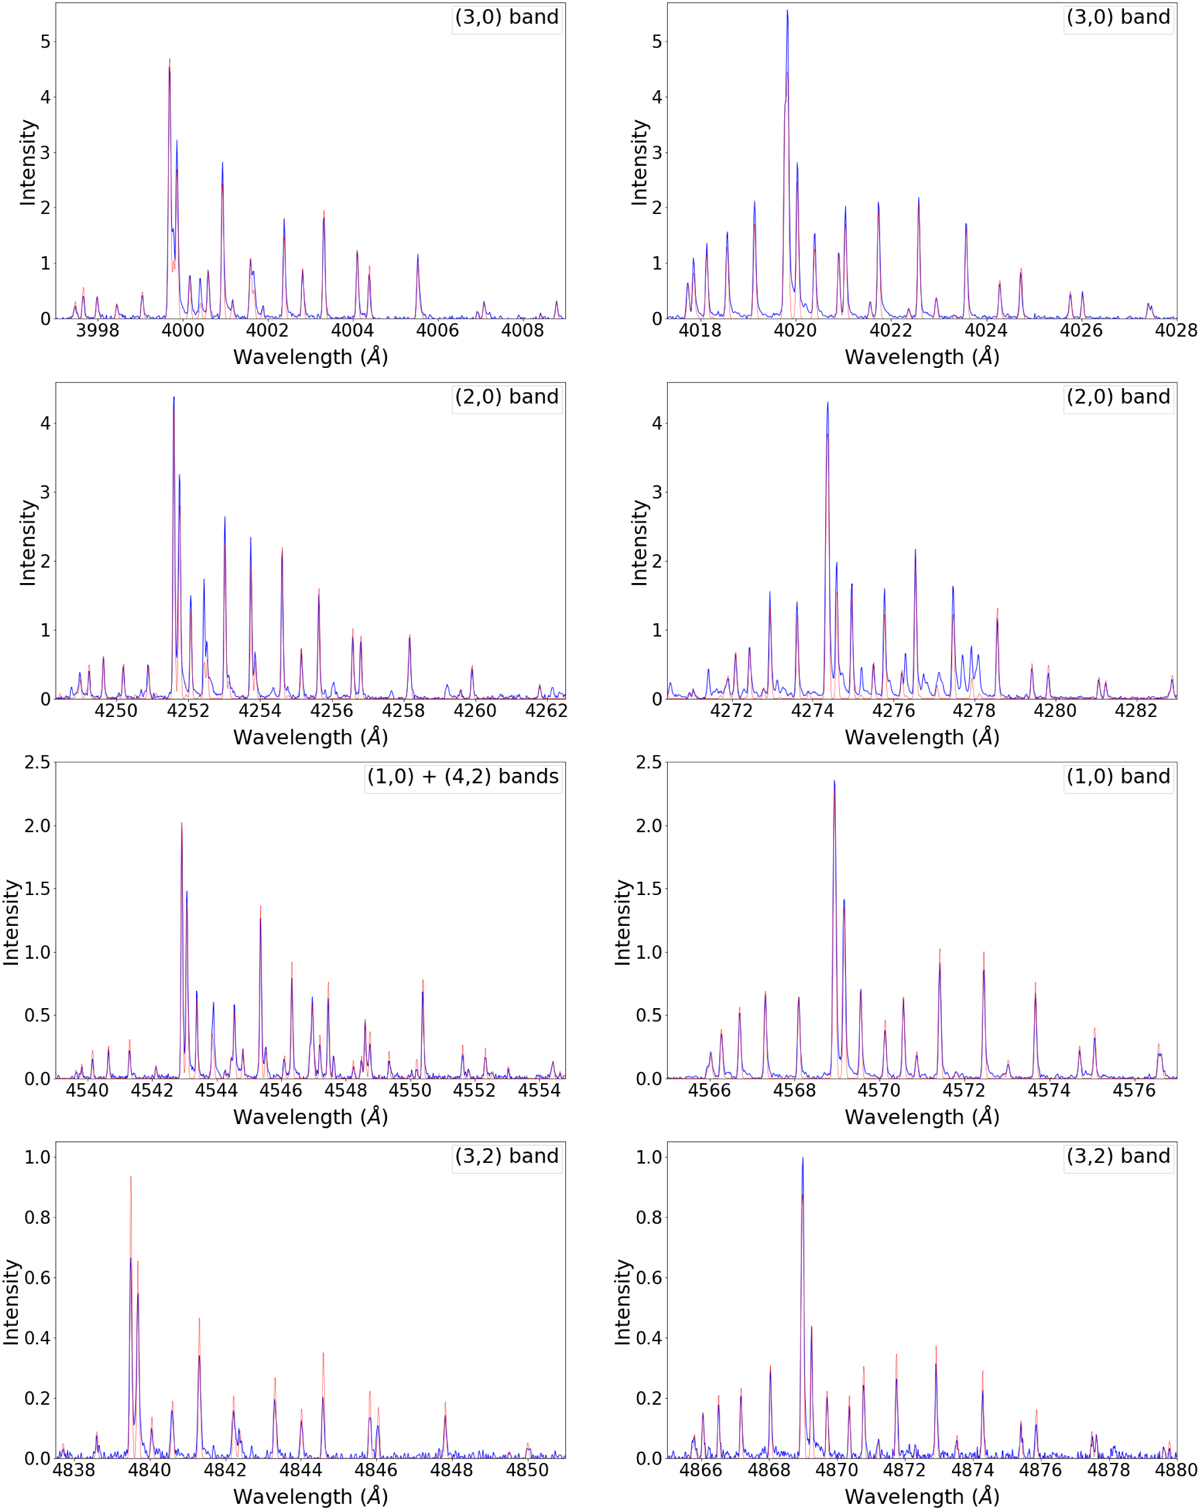
Comparison of our modeling of 12CO+ spectrum with our observational data obtained on comet C/2016 R2 for different bands observed with the setting 437. The intensity scale is arbitrary but proportional to units of ergs s−1 and is the same for the different bands. The observational spectrum appears in blue, while the modeling is in red. The emission lines of the (1,0) Π1/2 band are mixed with the emission lines of the (4,2) Π3/2 band, these last ones being fainter (intensities roughly equal to the ones of the (3,2) Π3/2 band).
Current usage metrics show cumulative count of Article Views (full-text article views including HTML views, PDF and ePub downloads, according to the available data) and Abstracts Views on Vision4Press platform.
Data correspond to usage on the plateform after 2015. The current usage metrics is available 48-96 hours after online publication and is updated daily on week days.
Initial download of the metrics may take a while.