Fig. 5
Download original image
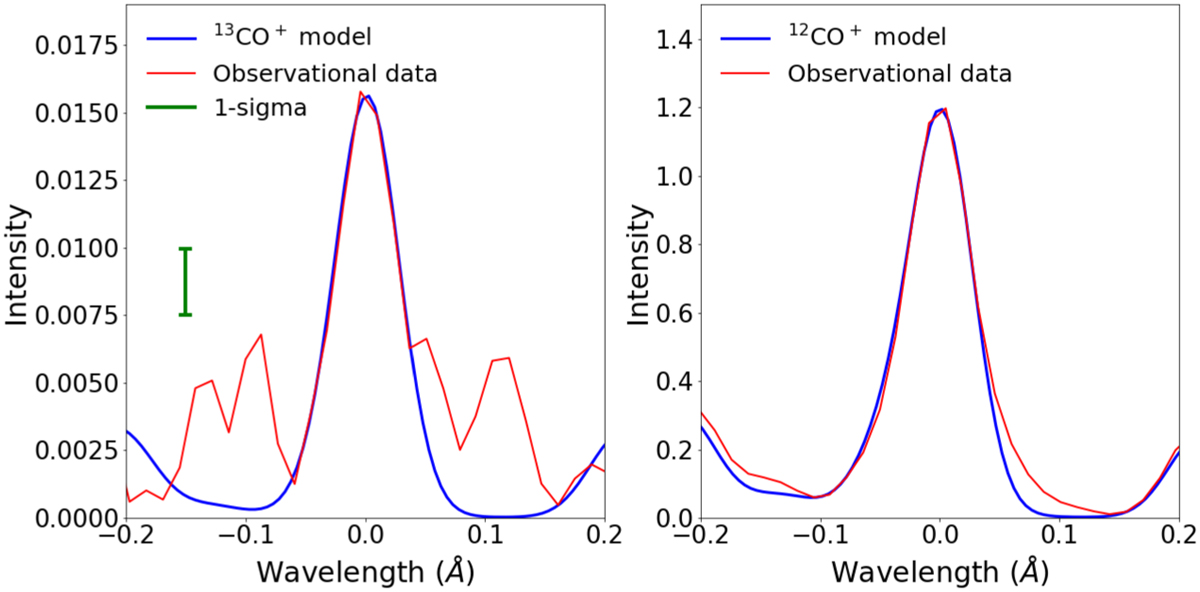
Co-adding of the brightest (3,0) and (2,0) emission lines of 13CO+ (left) and 12CO+ (right) with the corresponding modeling (see Table 4 for the detailed list of co-added lines). Both figures display the co-added CO+ lines with their surroundings at a high signal-to-noise ratio. The features seen – especially for 13CO+, which has a lower intensity scale – are then most probably real features above the one-sigma noise level appearing on the left part of this plot.
Current usage metrics show cumulative count of Article Views (full-text article views including HTML views, PDF and ePub downloads, according to the available data) and Abstracts Views on Vision4Press platform.
Data correspond to usage on the plateform after 2015. The current usage metrics is available 48-96 hours after online publication and is updated daily on week days.
Initial download of the metrics may take a while.