Fig. 4
Download original image
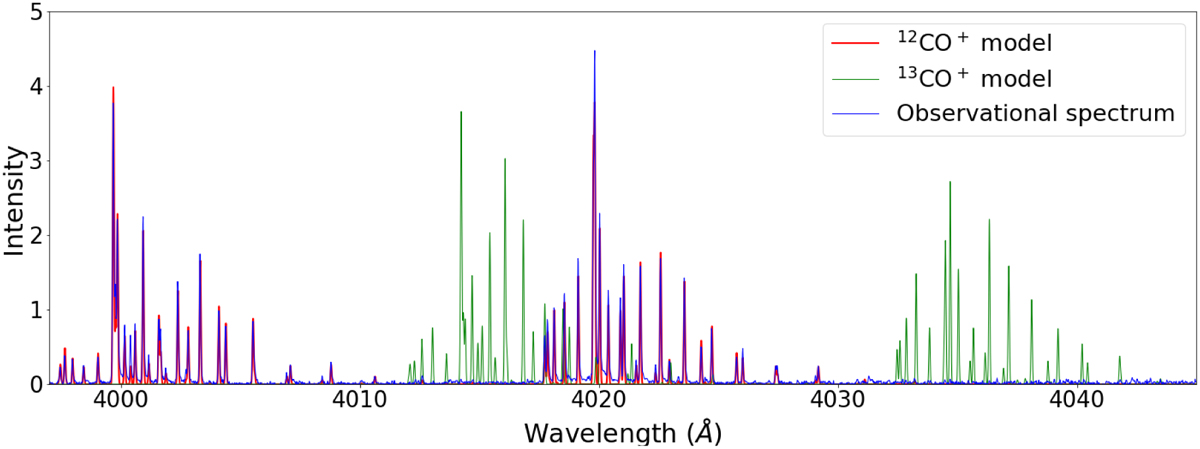
12CO+ and 13CO+ theoretical spectra superimposed on the observational data obtained on comet C/2016 R2. The relative intensity of 13CO+ emission lines are based on the 12CO+ fit of the emission lines (i.e., a theoretical ratio 12CO+/13CO+ = 1). They do not respect the intensities observed in this comet, the purpose of this plot being only to show the wavelength shift between the emission lines of these two isotopologues.
Current usage metrics show cumulative count of Article Views (full-text article views including HTML views, PDF and ePub downloads, according to the available data) and Abstracts Views on Vision4Press platform.
Data correspond to usage on the plateform after 2015. The current usage metrics is available 48-96 hours after online publication and is updated daily on week days.
Initial download of the metrics may take a while.