Fig. 2
Download original image
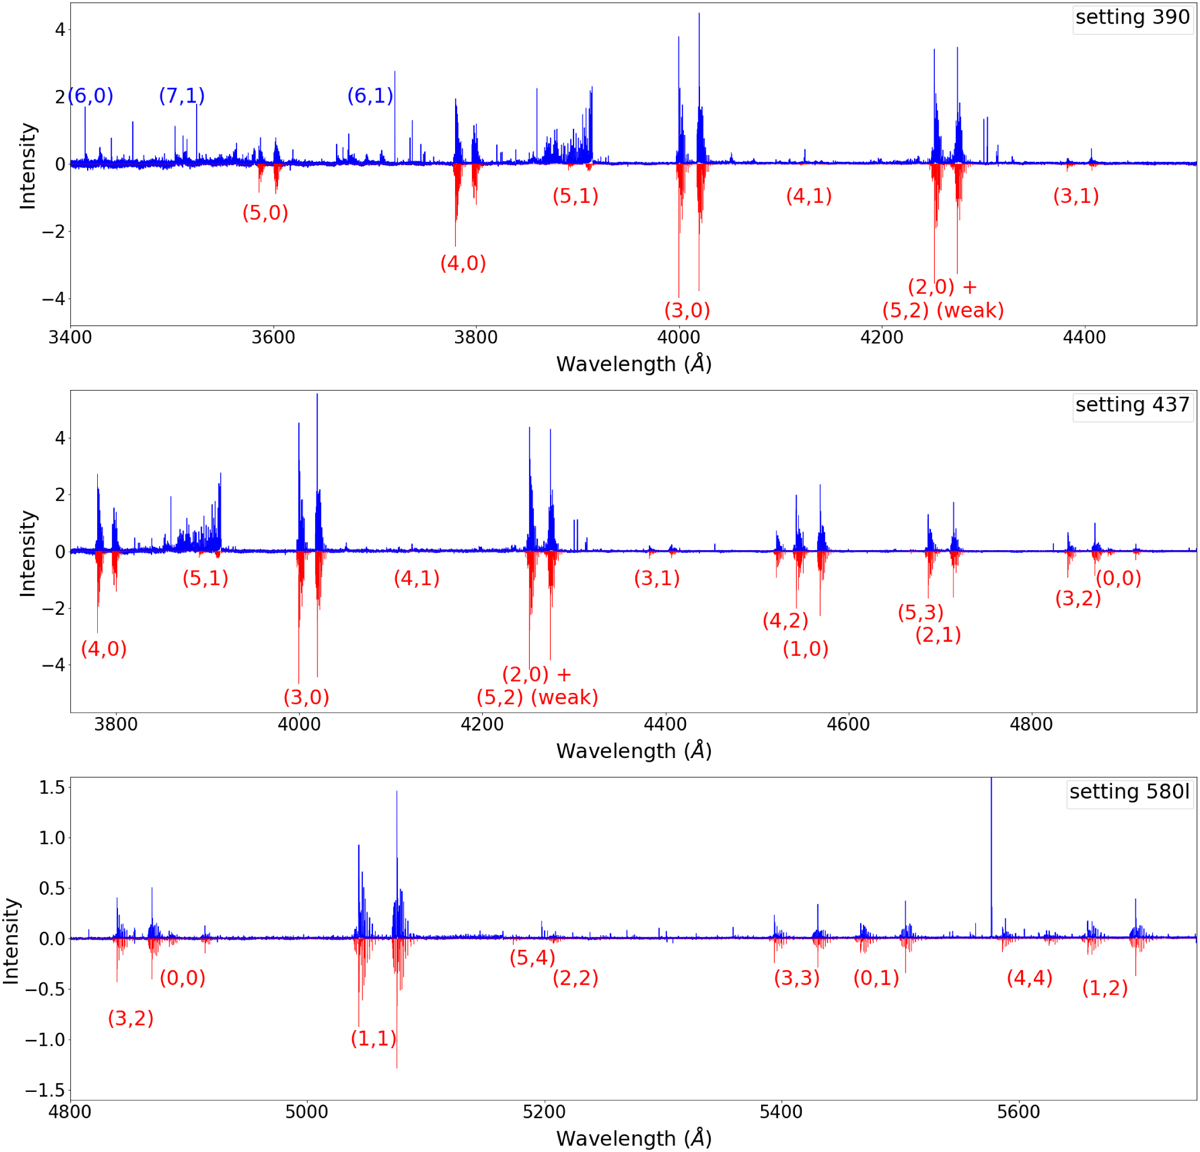
Comparison of our modeling of 12CO+ spectrum with our observational data obtained on comet C/2016 R2 for the three different settings. The observational spectra appear in blue, while the model is in red (for clarity it appears with a negative scale). The different CO+ bands bright enough to be detected in the observational spectrum are identified in red for the model. The (6,0), (7,1), and (6,1) CO+ bands appear (weakly) on the observational spectrum and are identified in blue, but not on the model because this one is restricted to v″ and v′ ≤ 5. The intensity scale is arbitrary but proportional to units of ergs s-1. Some other species appear in the observational spectrum (e.g., ![]() and CN emission lines near the (5,1) CO+ band).
and CN emission lines near the (5,1) CO+ band).
Current usage metrics show cumulative count of Article Views (full-text article views including HTML views, PDF and ePub downloads, according to the available data) and Abstracts Views on Vision4Press platform.
Data correspond to usage on the plateform after 2015. The current usage metrics is available 48-96 hours after online publication and is updated daily on week days.
Initial download of the metrics may take a while.