Fig. 6.
Download original image
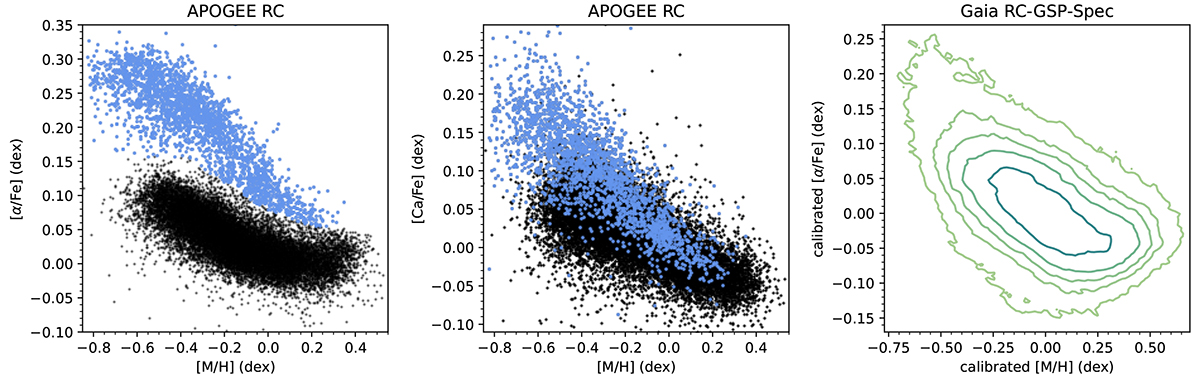
Red clump stars in chemical abundance space. Left: distribution of the APOGEE RC stars in the [α/Fe]-metallicity plane. The α-rich stars are highlighted manually. Middle: same stars in the [Ca/Fe]-metallicity plane. The [Ca/Fe] abundances do not have the same discriminating power as [α/Fe], which accounts for O, Mg, Si, S, and Ca for APOGEE. Right: distribution of the Gaia RC-GSP-Spec stars in the [α/Fe]-metallicity plane. The contours enclose 99%, 95%, 90%, 80%, and 50% of the sample. The Gaiaα-abundances are dominated by Ca lines and do not allow us to reliably distinguish the α-rich from the α-poor disc stars.
Current usage metrics show cumulative count of Article Views (full-text article views including HTML views, PDF and ePub downloads, according to the available data) and Abstracts Views on Vision4Press platform.
Data correspond to usage on the plateform after 2015. The current usage metrics is available 48-96 hours after online publication and is updated daily on week days.
Initial download of the metrics may take a while.