Fig. 5.
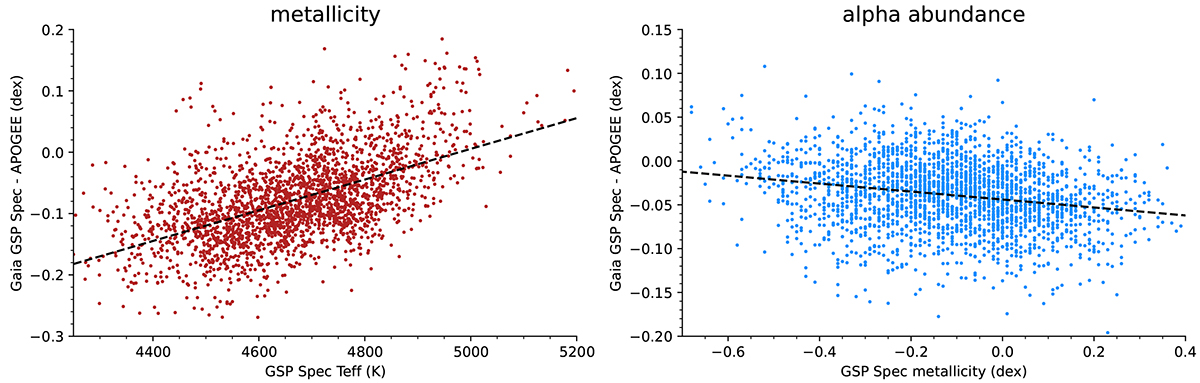
Download original image
Abundance-scaling relations of Gaia DR3 GSP-Spec and APOGEE DR17 ASCAP abundances for a sample of 2450 red clump stars in common. Left: offset between Gaia DR3 mh_gspspec metallicities and APOGEE DR17 ASCAP [M/H]. Right: offset between [α/Fe] (from GSP-Spec) and [Ca/Fe] (from APOGEE). In both panels, the dashed line indicates the correction we applied to calibrate Gaia on the APOGEE scale, given in Eqs. (4) and (5).
Current usage metrics show cumulative count of Article Views (full-text article views including HTML views, PDF and ePub downloads, according to the available data) and Abstracts Views on Vision4Press platform.
Data correspond to usage on the plateform after 2015. The current usage metrics is available 48-96 hours after online publication and is updated daily on week days.
Initial download of the metrics may take a while.