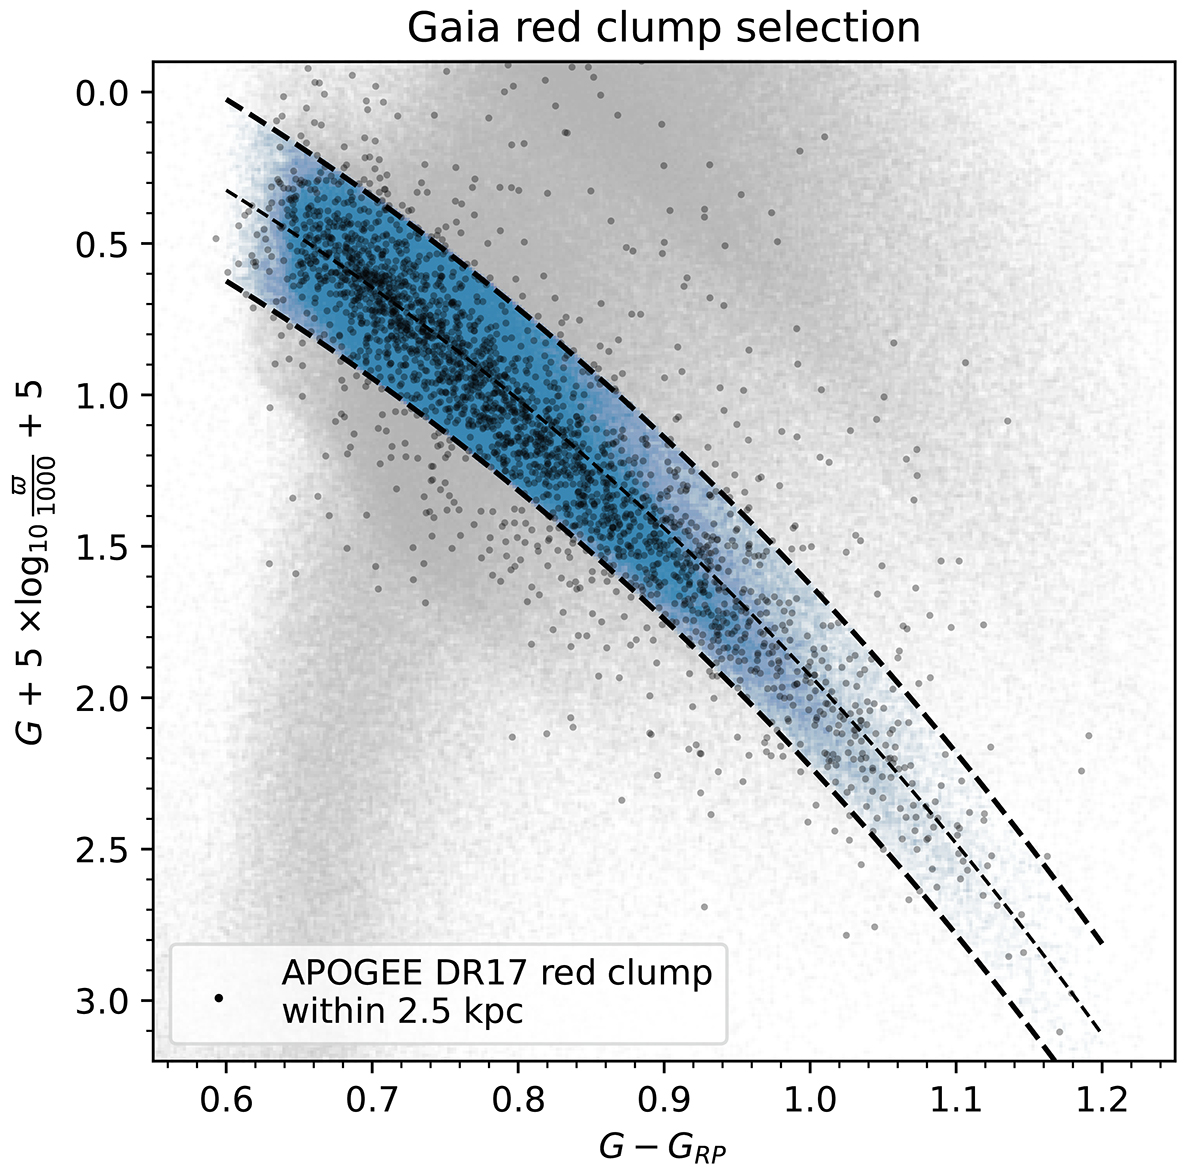
Fig. 4.
Download original image
Definition of the Gaia red clump star sample (see Sect. 2.2.1). The shaded area between the dashed lines represents our selection from the Gaia DR3 photometry described in Sect. 2.2.1, based upon the APOGEE DR17 red clump candidates indicated by the black dots. The grey background indicates the density of all sources in the “gradient sample” of Gaia Collaboration (2023) for reference.
Current usage metrics show cumulative count of Article Views (full-text article views including HTML views, PDF and ePub downloads, according to the available data) and Abstracts Views on Vision4Press platform.
Data correspond to usage on the plateform after 2015. The current usage metrics is available 48-96 hours after online publication and is updated daily on week days.
Initial download of the metrics may take a while.