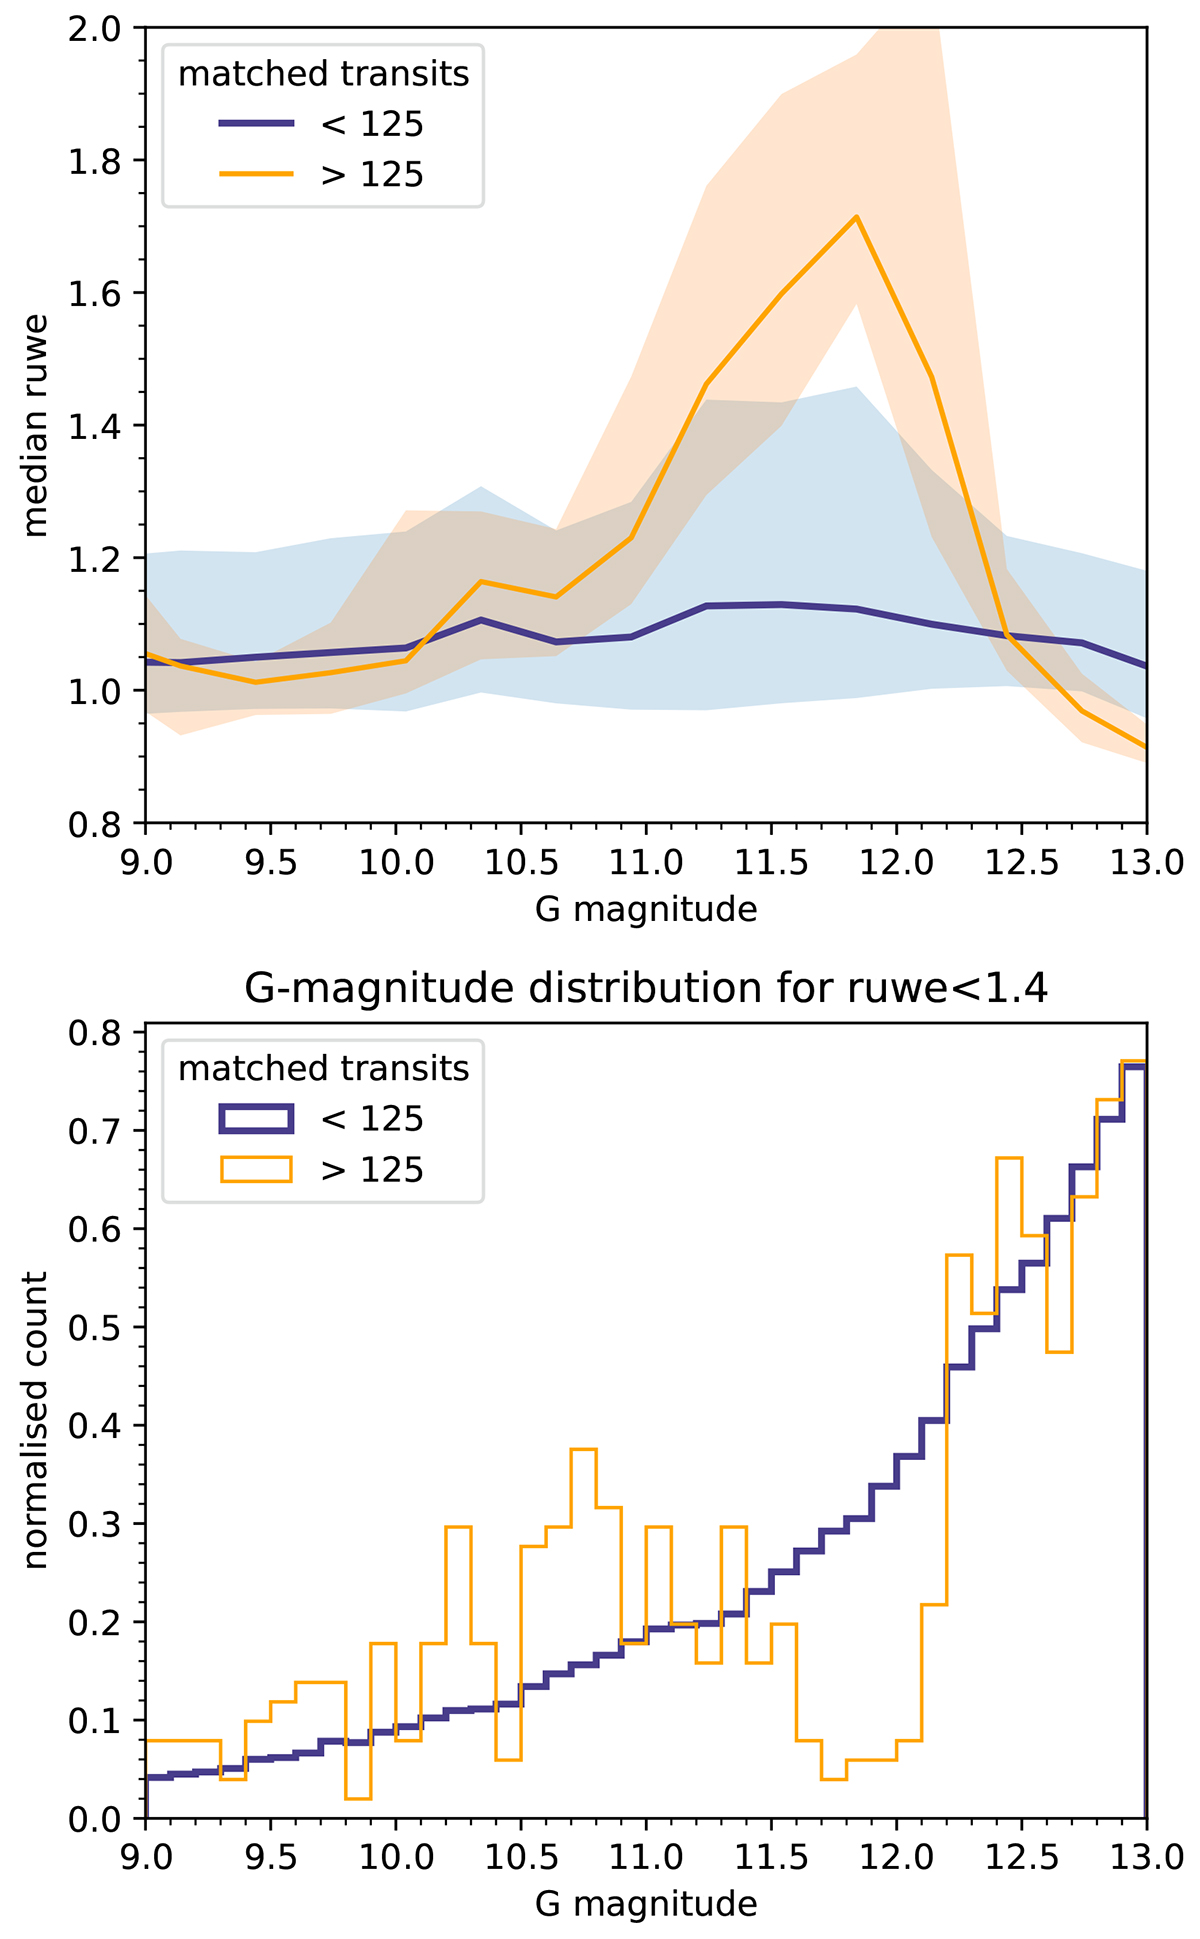
Fig. A.2.
Download original image
Effect of magnitude and number of matched transits on ruwe. Top: Median ruwe value in bins of 0.3 mag for sources with fewer and with more than 125 matched transits. The shaded area corresponds to the 25th to 75th percentile range. Bottom: G-magnitude distribution of the sources with ruwe < 1.4, and with fewer or more than 125 matched transits.
Current usage metrics show cumulative count of Article Views (full-text article views including HTML views, PDF and ePub downloads, according to the available data) and Abstracts Views on Vision4Press platform.
Data correspond to usage on the plateform after 2015. The current usage metrics is available 48-96 hours after online publication and is updated daily on week days.
Initial download of the metrics may take a while.