Fig. 13.
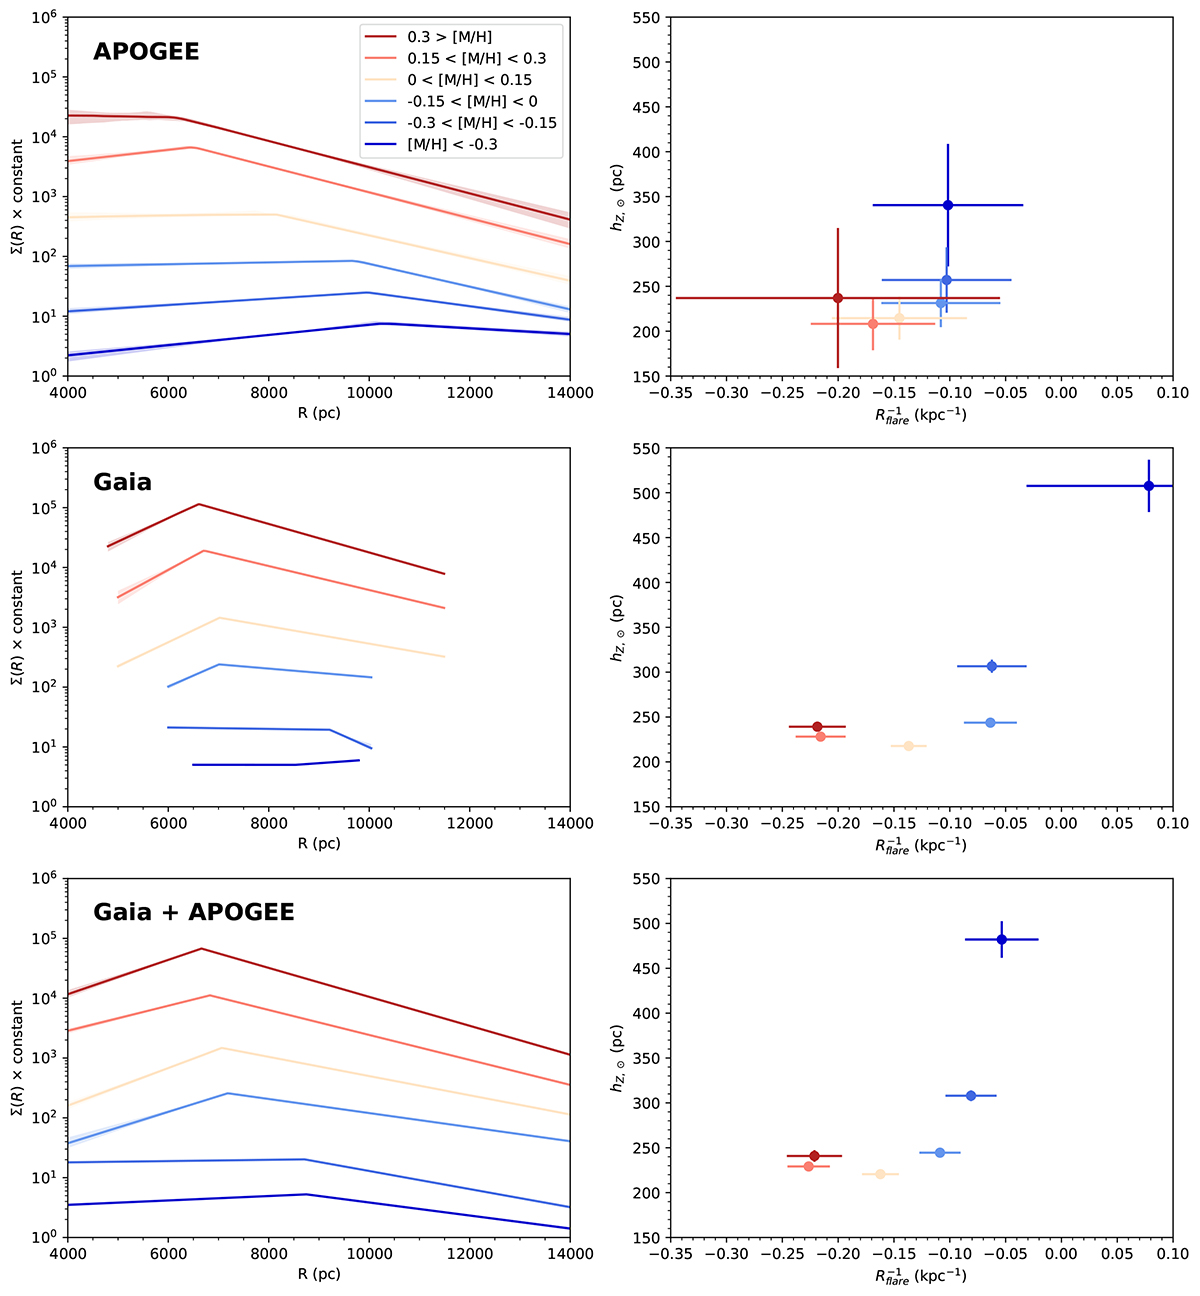
Download original image
Density profiles of red clump stars from APOGEE, Gaia RC-GSP-Spec, and their combined data sets (from top to bottom). The left panels show the radial density profiles Σ(R) obtained in six ranges of metallicity in the α-poor disc ([α/Fe]< 0.1 dex). The profiles are shifted by an arbitrary offset to be visually separated. The panels on the right represent the flaring scale length and vertical scale height predicted by our model for each metallicity bin. The shaded areas (left) and error bars (right) represent the 95% confidence interval. The Gaia RC-GSP-Spec star sample covers a smaller range in R, especially at low metallicity. We list the best-fit parameters in Table D.1.
Current usage metrics show cumulative count of Article Views (full-text article views including HTML views, PDF and ePub downloads, according to the available data) and Abstracts Views on Vision4Press platform.
Data correspond to usage on the plateform after 2015. The current usage metrics is available 48-96 hours after online publication and is updated daily on week days.
Initial download of the metrics may take a while.