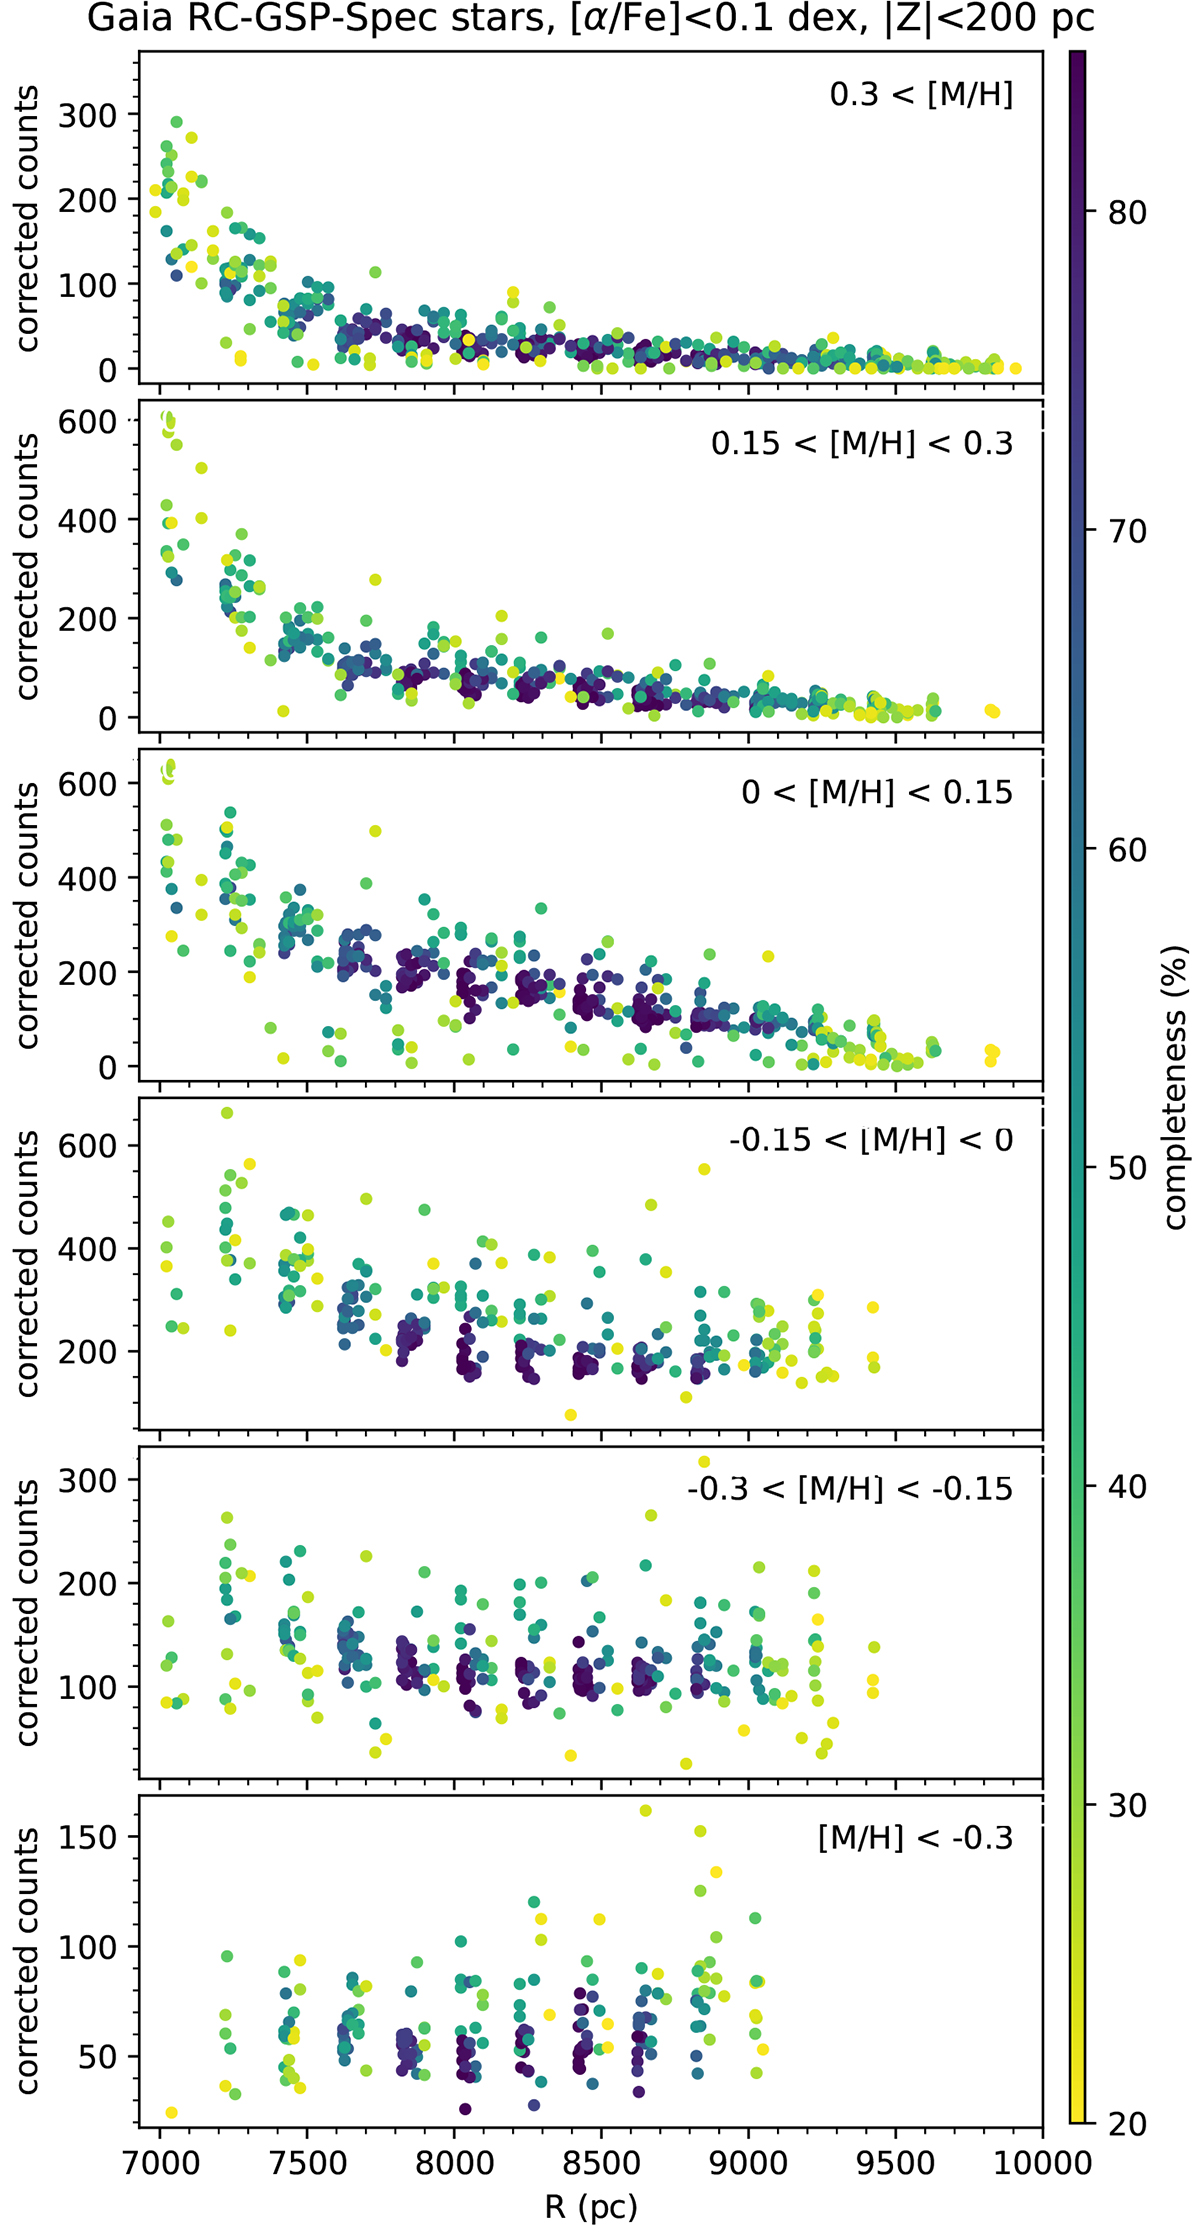
Fig. 11.
Download original image
Completeness-corrected number of α-poor RC-GSP-Spec stars in bins of Galactic (X, Y) bins of 200 × 200 × 200 pc near the Galactic mid-plane (−200 < Z < 200 pc) as a function of galactocentric distance in parsecs. We selected α-poor stars as [α/Fe]< 0.1 dex. A dot represents the corrected density for regions in which the expected completeness is greater than 20%. The top and bottom panels correspond to the data displayed in the top left and top right panels of Fig. 10, respectively. We stress that the observed counts should only be divided by completeness for qualitative visualisation and data exploration purposes. Section 3.3 implements a forward-modelling approach to apply the selection function to a density model.
Current usage metrics show cumulative count of Article Views (full-text article views including HTML views, PDF and ePub downloads, according to the available data) and Abstracts Views on Vision4Press platform.
Data correspond to usage on the plateform after 2015. The current usage metrics is available 48-96 hours after online publication and is updated daily on week days.
Initial download of the metrics may take a while.