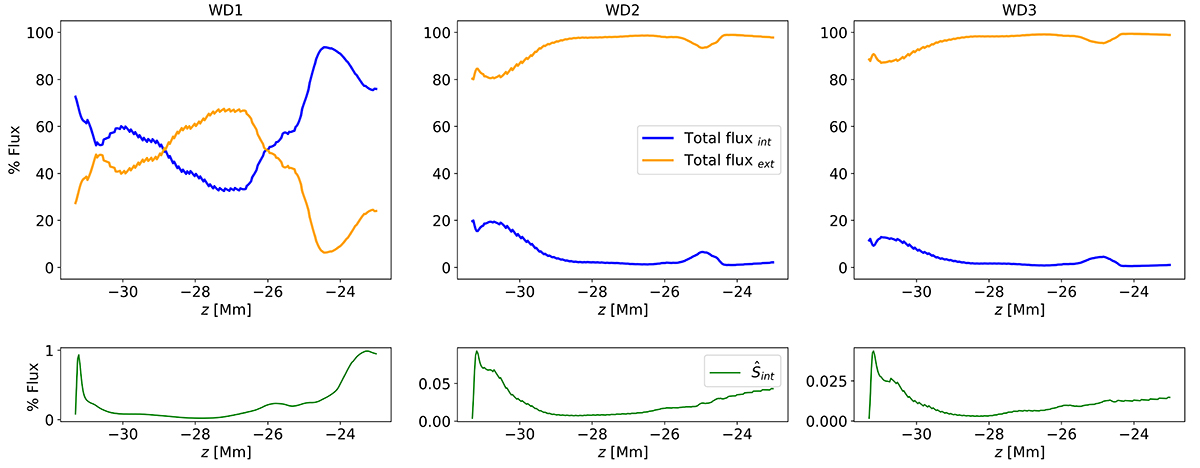
Fig. 9.
Download original image
Wave energy flux percentages, calculated using Eq. (10), contained within the loop (blue line) and outside the loop (orange line) at different heights for the wave drivers modelled in this work. The loop boundary is defined as the local radial position of field line 2 at each height. The wave energy flux is integrated over the final driving period (T3−T4) and additionally integrated over all azimuthal angles. The bottom panels display the contribution of the total Poynting flux inside the loop (green line). The left, middle and right panels indicate the simulations of WD1, WD2, and WD3, respectively.
Current usage metrics show cumulative count of Article Views (full-text article views including HTML views, PDF and ePub downloads, according to the available data) and Abstracts Views on Vision4Press platform.
Data correspond to usage on the plateform after 2015. The current usage metrics is available 48-96 hours after online publication and is updated daily on week days.
Initial download of the metrics may take a while.