Fig. 7.
Download original image
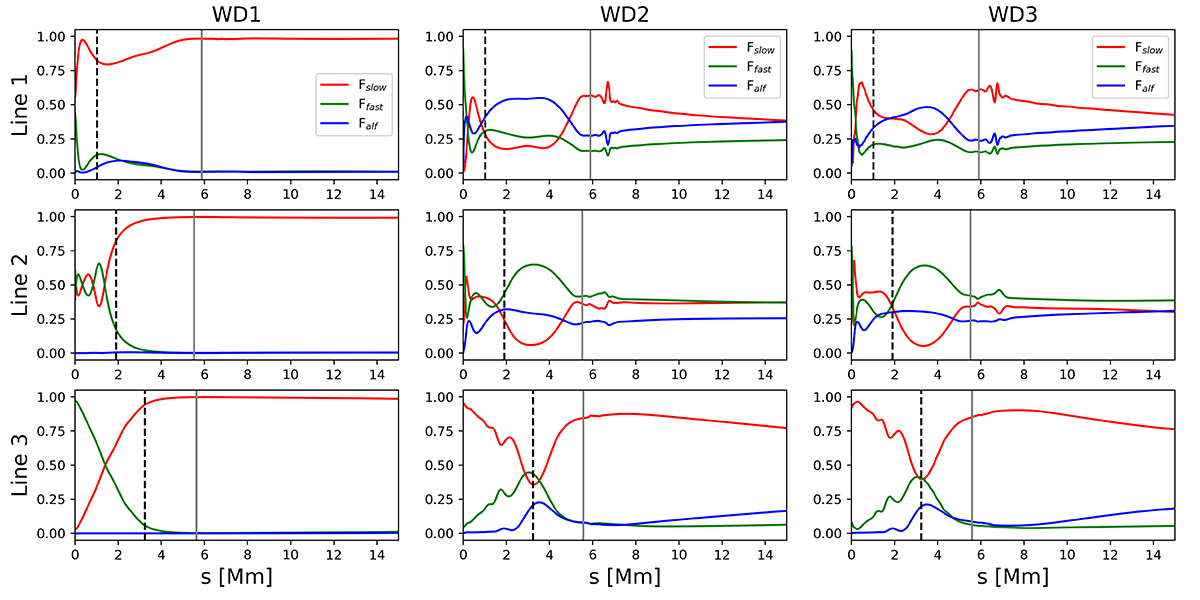
Potential wave energy fluxes calculated using Eqs. (11)–(13). We show the “available” energy flux associated with slow magnetoacoustic (red curve), fast magnetoacoustic (green curve), and Alfvén (blue curve) waves. The energy fluxes are plotted along the respective field lines with the distance along the field line denoted by the variable s. The energy fluxes are plotted for the three different field lines shown in Fig. 2, with line 1 (top row), line 2 (middle row) and line 3 (bottom row). The left column shows the results for the simulation of the centred, inclined wave driver (WD1), the middle column shows the result for the shifted vertical wave driver (WD2) whereas the right column is for WD3 (Table 1). Finally, the average position of the plasma-β = 1 layer and transition region are denoted by the black dashed line and grey solid line, respectively. All plots are normalised such that the sum of all energy fluxes equals unity at every respective height.
Current usage metrics show cumulative count of Article Views (full-text article views including HTML views, PDF and ePub downloads, according to the available data) and Abstracts Views on Vision4Press platform.
Data correspond to usage on the plateform after 2015. The current usage metrics is available 48-96 hours after online publication and is updated daily on week days.
Initial download of the metrics may take a while.