Fig. 5.
Download original image
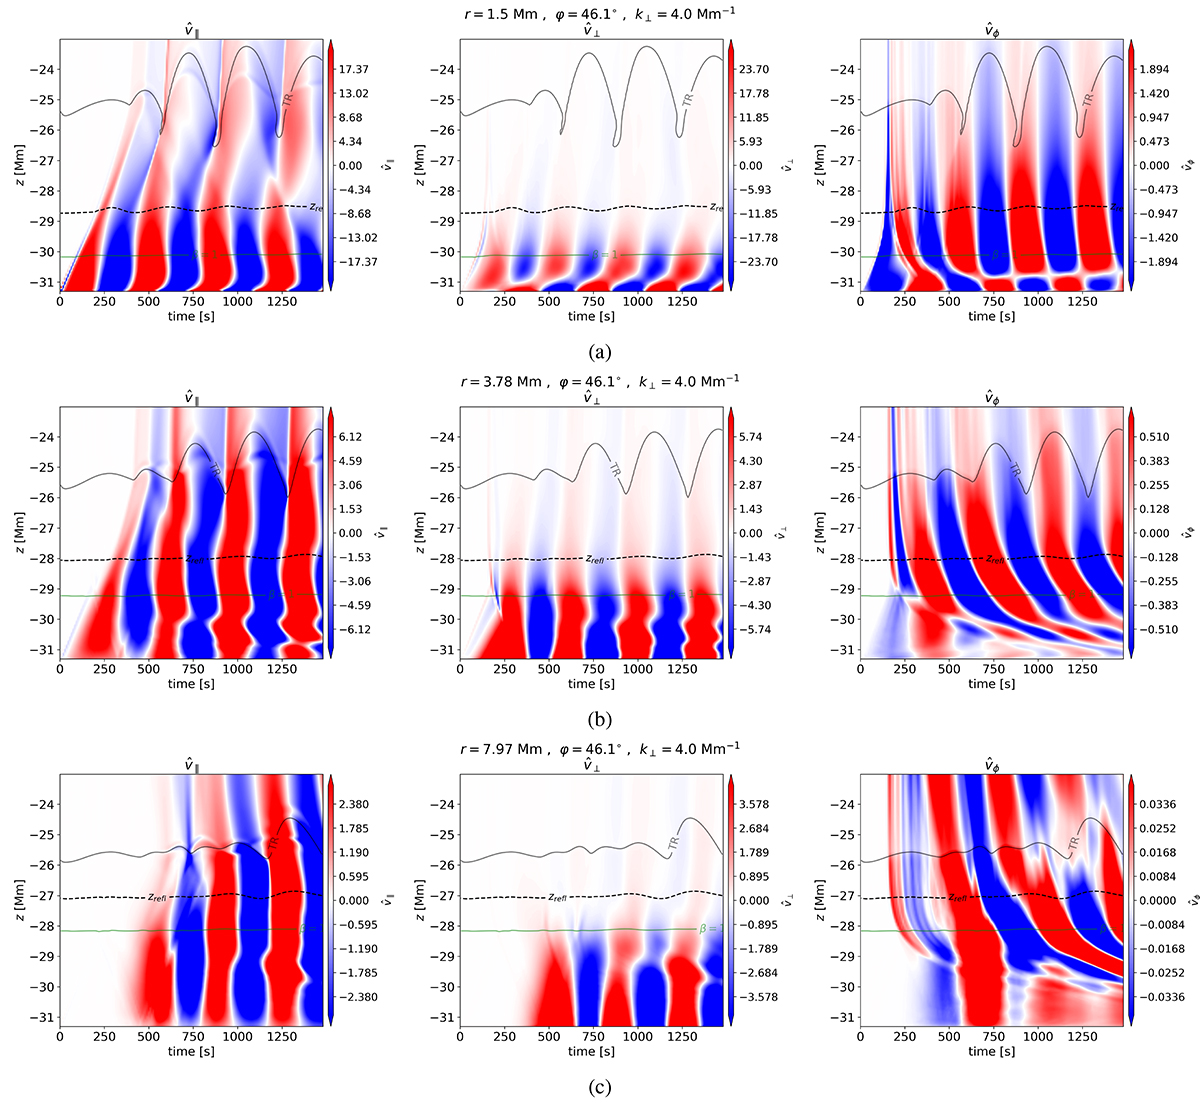
Time–distance plots of the scaled velocities for the perturbations parallel, perpendicular, and azimuthal to magnetic flux surfaces, a proxy for the slow magnetoacoustic mode (left), fast magnetoacoustic mode (middle) and Alfvén mode (right), respectively. All plots are for the case of a localised inclined driver of 15° (WD1) for an azimuthal slice φ = 46.1° at three different radial cuts of (a) r = 1.5 Mm, (b) r = 3.78 Mm and (c) r = 7.97 Mm. The β = 1, fast mode reflection (zrefl) and transition region layers are shown by the green, black dashed and grey contours, respectively. For the purpose of this illustration, the fast mode reflection height was calculated using a horizontal wavenumber k⊥ = 4.0 Mm−1. Note the different colour bar used for the ![]() ,
, ![]() and
and ![]() components in all panels.
components in all panels.
Current usage metrics show cumulative count of Article Views (full-text article views including HTML views, PDF and ePub downloads, according to the available data) and Abstracts Views on Vision4Press platform.
Data correspond to usage on the plateform after 2015. The current usage metrics is available 48-96 hours after online publication and is updated daily on week days.
Initial download of the metrics may take a while.