Fig. 4.
Download original image
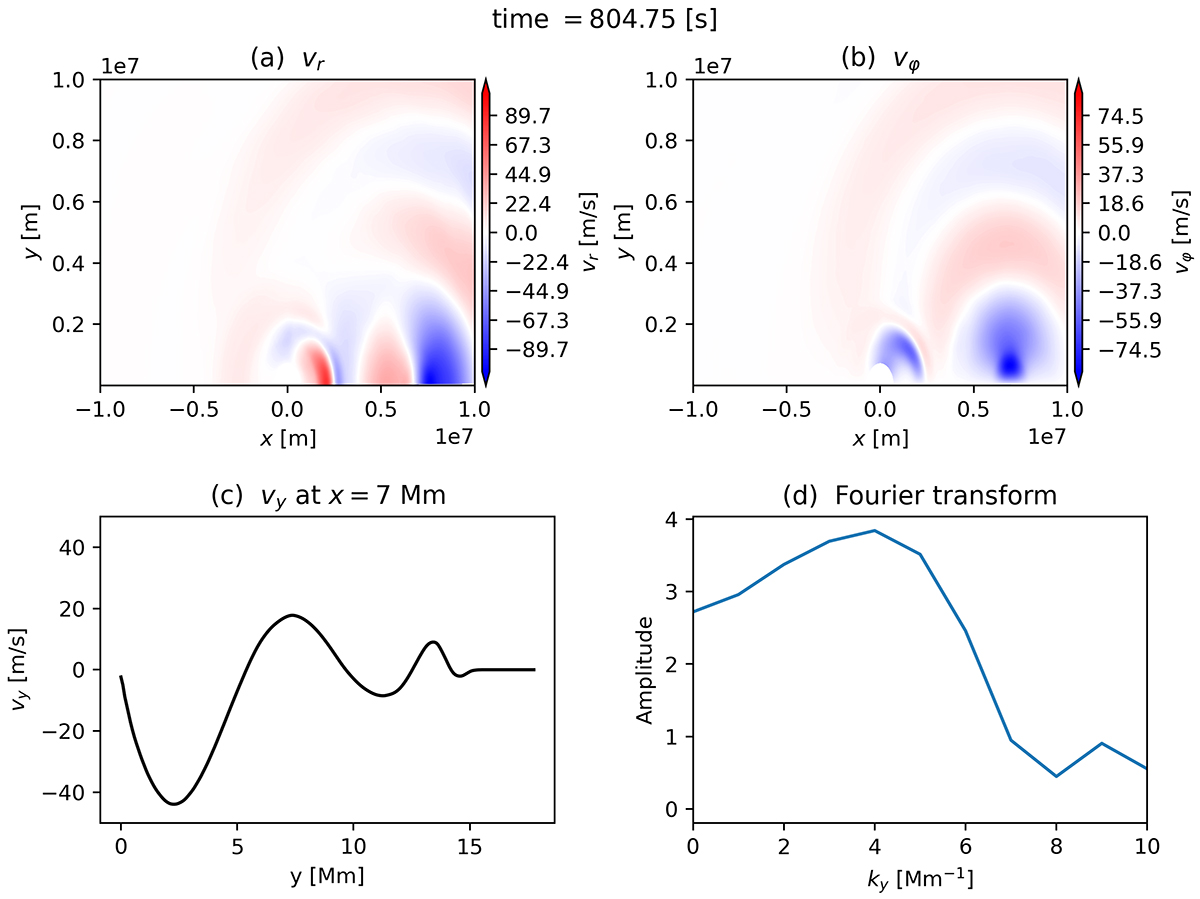
Snapshots of the radial (a) and azimuthal (b) velocity perturbations across the bottom boundary of the domain at a time t = 805 s in the shifted wave driver simulation WD2. The signal for the velocity perturbation vy (after converting to Cartesian coordinates) is shown in panel c for a slice taken along x = 7 Mm, where the shifted drivers (WD2 and WD3) are positioned. The resulting Fourier transform (d) of the signal in panel c allows us to compute the fast mode reflection height zrefl at this moment in space and time.
Current usage metrics show cumulative count of Article Views (full-text article views including HTML views, PDF and ePub downloads, according to the available data) and Abstracts Views on Vision4Press platform.
Data correspond to usage on the plateform after 2015. The current usage metrics is available 48-96 hours after online publication and is updated daily on week days.
Initial download of the metrics may take a while.