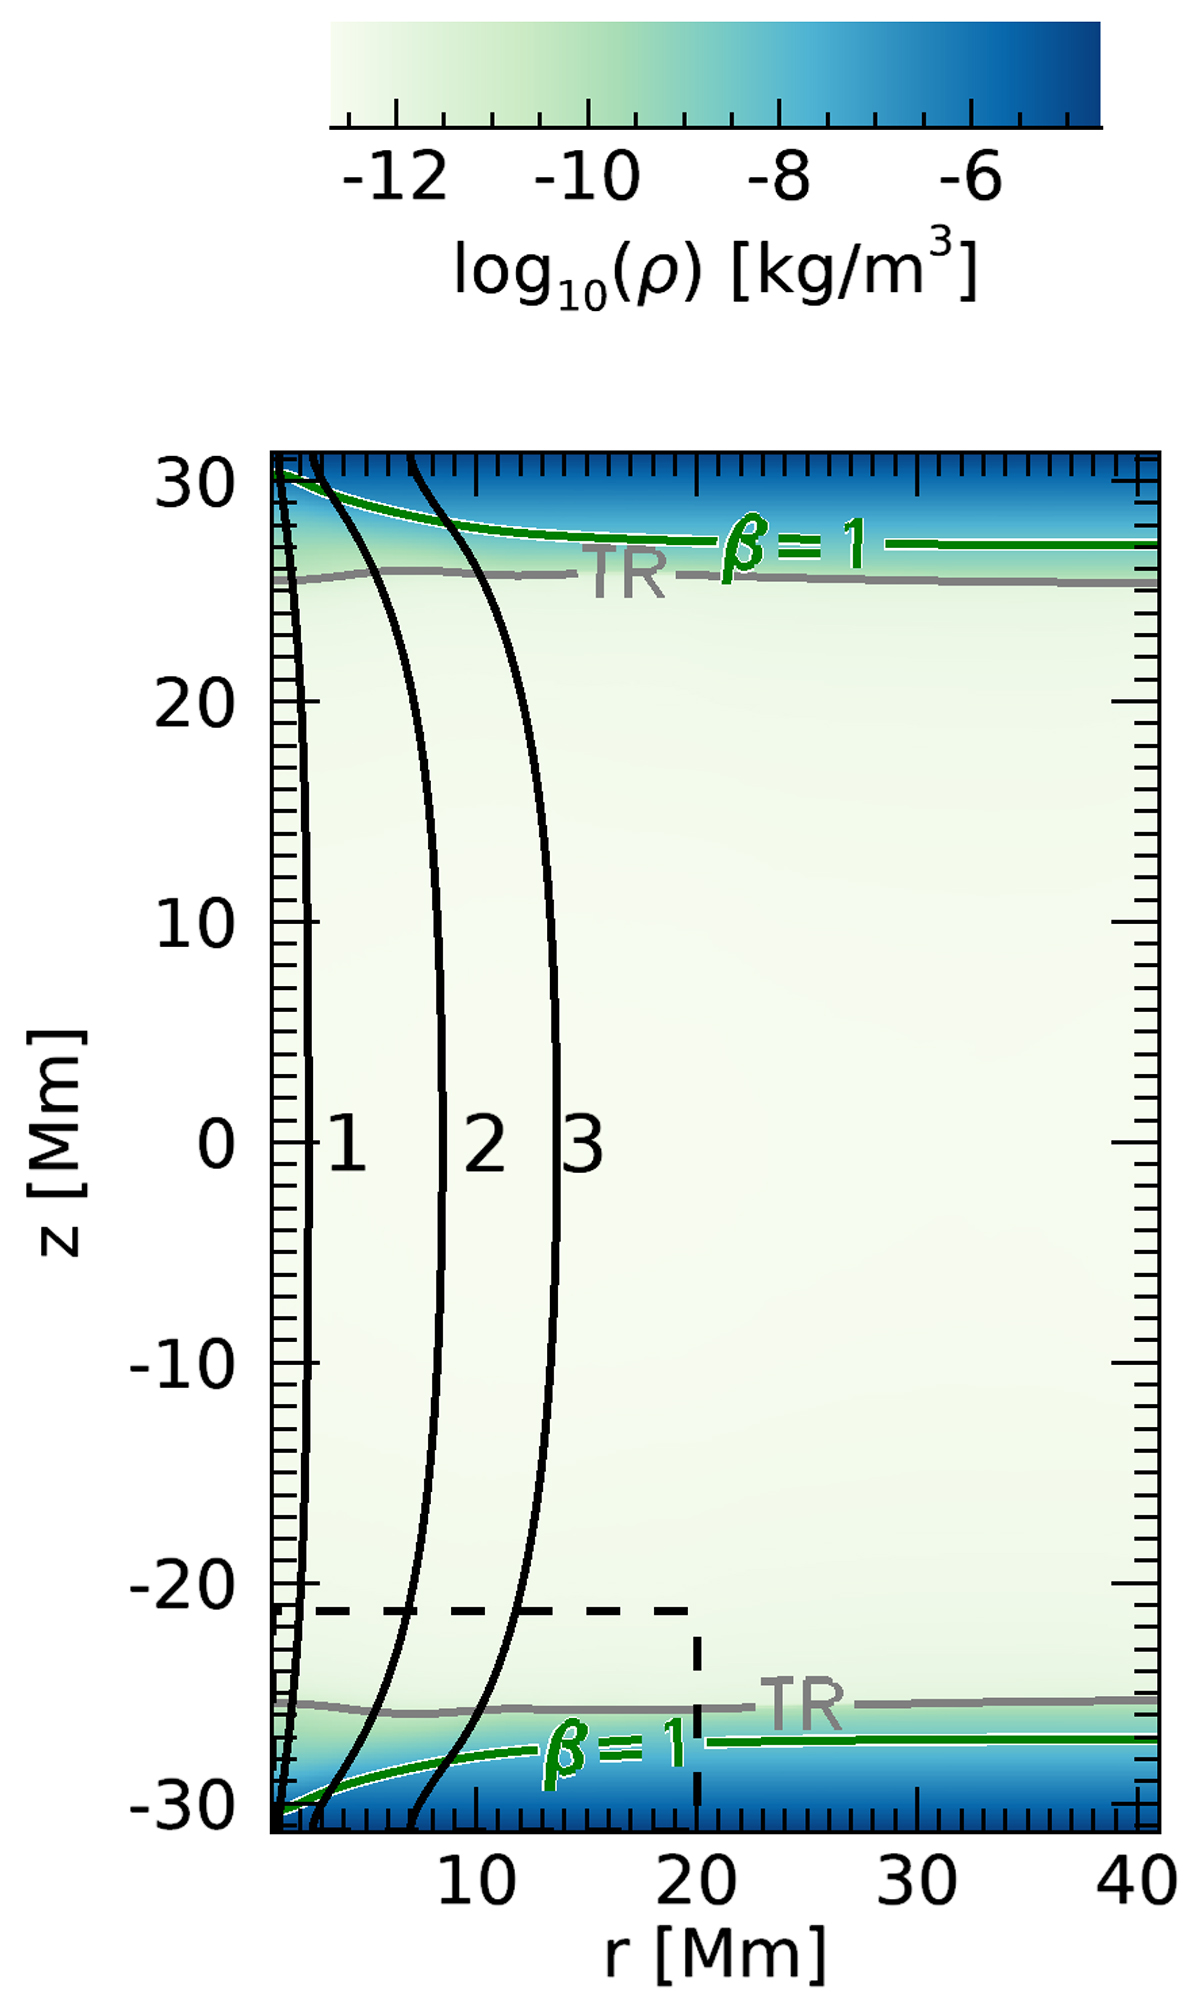
Fig. 1.
Download original image
Snapshot of the initial background density (log scale) in the simulation domain. The full domain is plotted, ranging from photosphere to photosphere at the top and bottom boundaries, with the apex of the loop positioned at z = 0 Mm. The positions of field lines 1, 2, and 3 are also indicated and used for the discussion in the text. Contours for the plasma-β = 1 layer and transition region are denoted by the green and grey lines, respectively. The black dashed box outlines the sub-domain used for analysis at various points in the present study.
Current usage metrics show cumulative count of Article Views (full-text article views including HTML views, PDF and ePub downloads, according to the available data) and Abstracts Views on Vision4Press platform.
Data correspond to usage on the plateform after 2015. The current usage metrics is available 48-96 hours after online publication and is updated daily on week days.
Initial download of the metrics may take a while.