Fig. 1.
Download original image
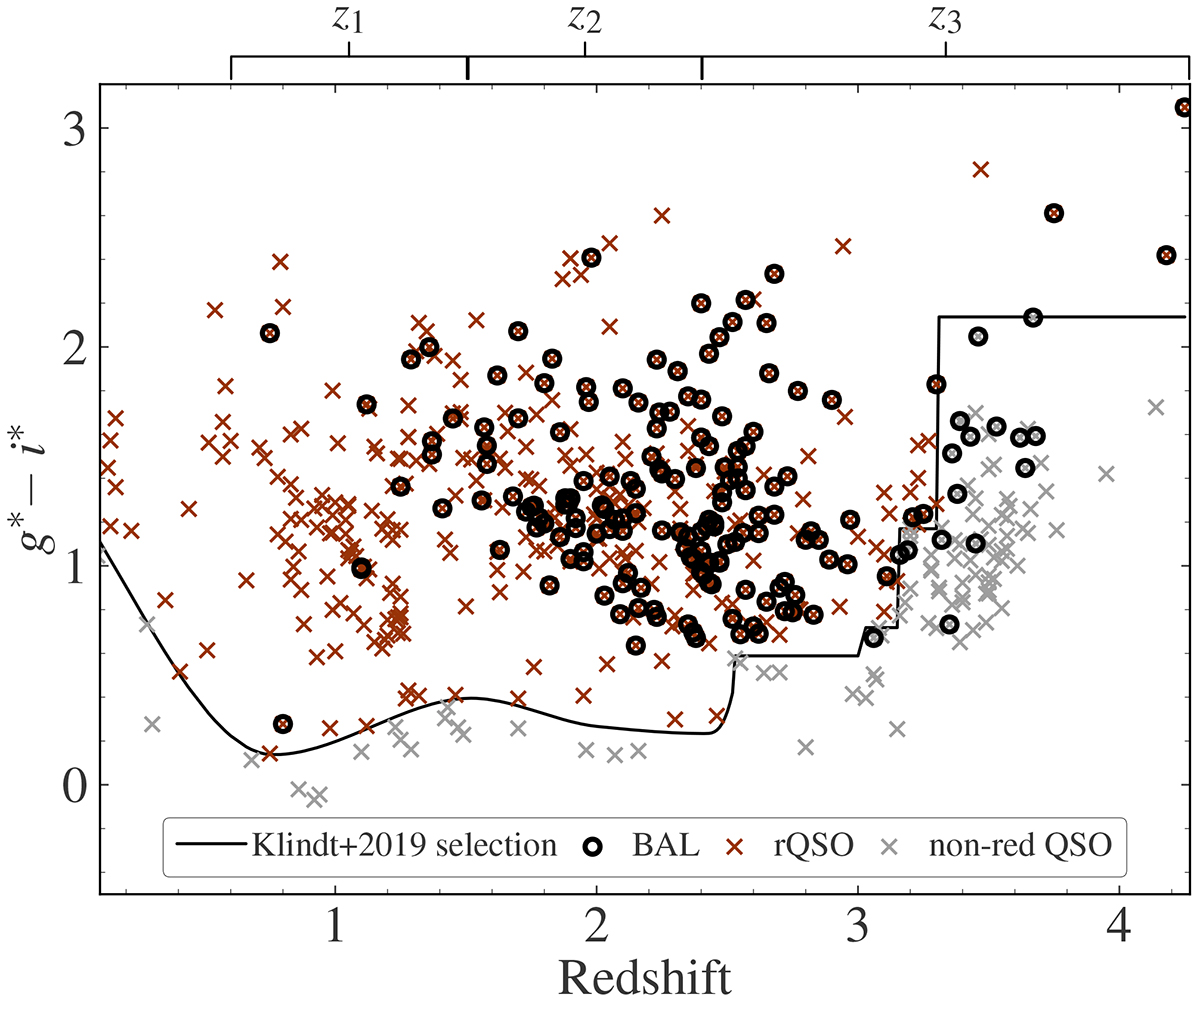
Distribution of the g* − i* color as a function of redshift for the quasars in the new quasar catalog. Every cross represents a quasar. The black line shows the red quasar selection criteria from Klindt et al. (2019), such that quasars with a higher color value are labeled rQSO and are shown in red in this figure, while those with a lower color value are labeled not-red QSO and are shown in gray in this figure. The categorization of the BAL quasars, marked with black circles, relied on visual assessment without the application of rigid standards (see F13, K15, K16, H20).
Current usage metrics show cumulative count of Article Views (full-text article views including HTML views, PDF and ePub downloads, according to the available data) and Abstracts Views on Vision4Press platform.
Data correspond to usage on the plateform after 2015. The current usage metrics is available 48-96 hours after online publication and is updated daily on week days.
Initial download of the metrics may take a while.