Fig. 9
Download original image
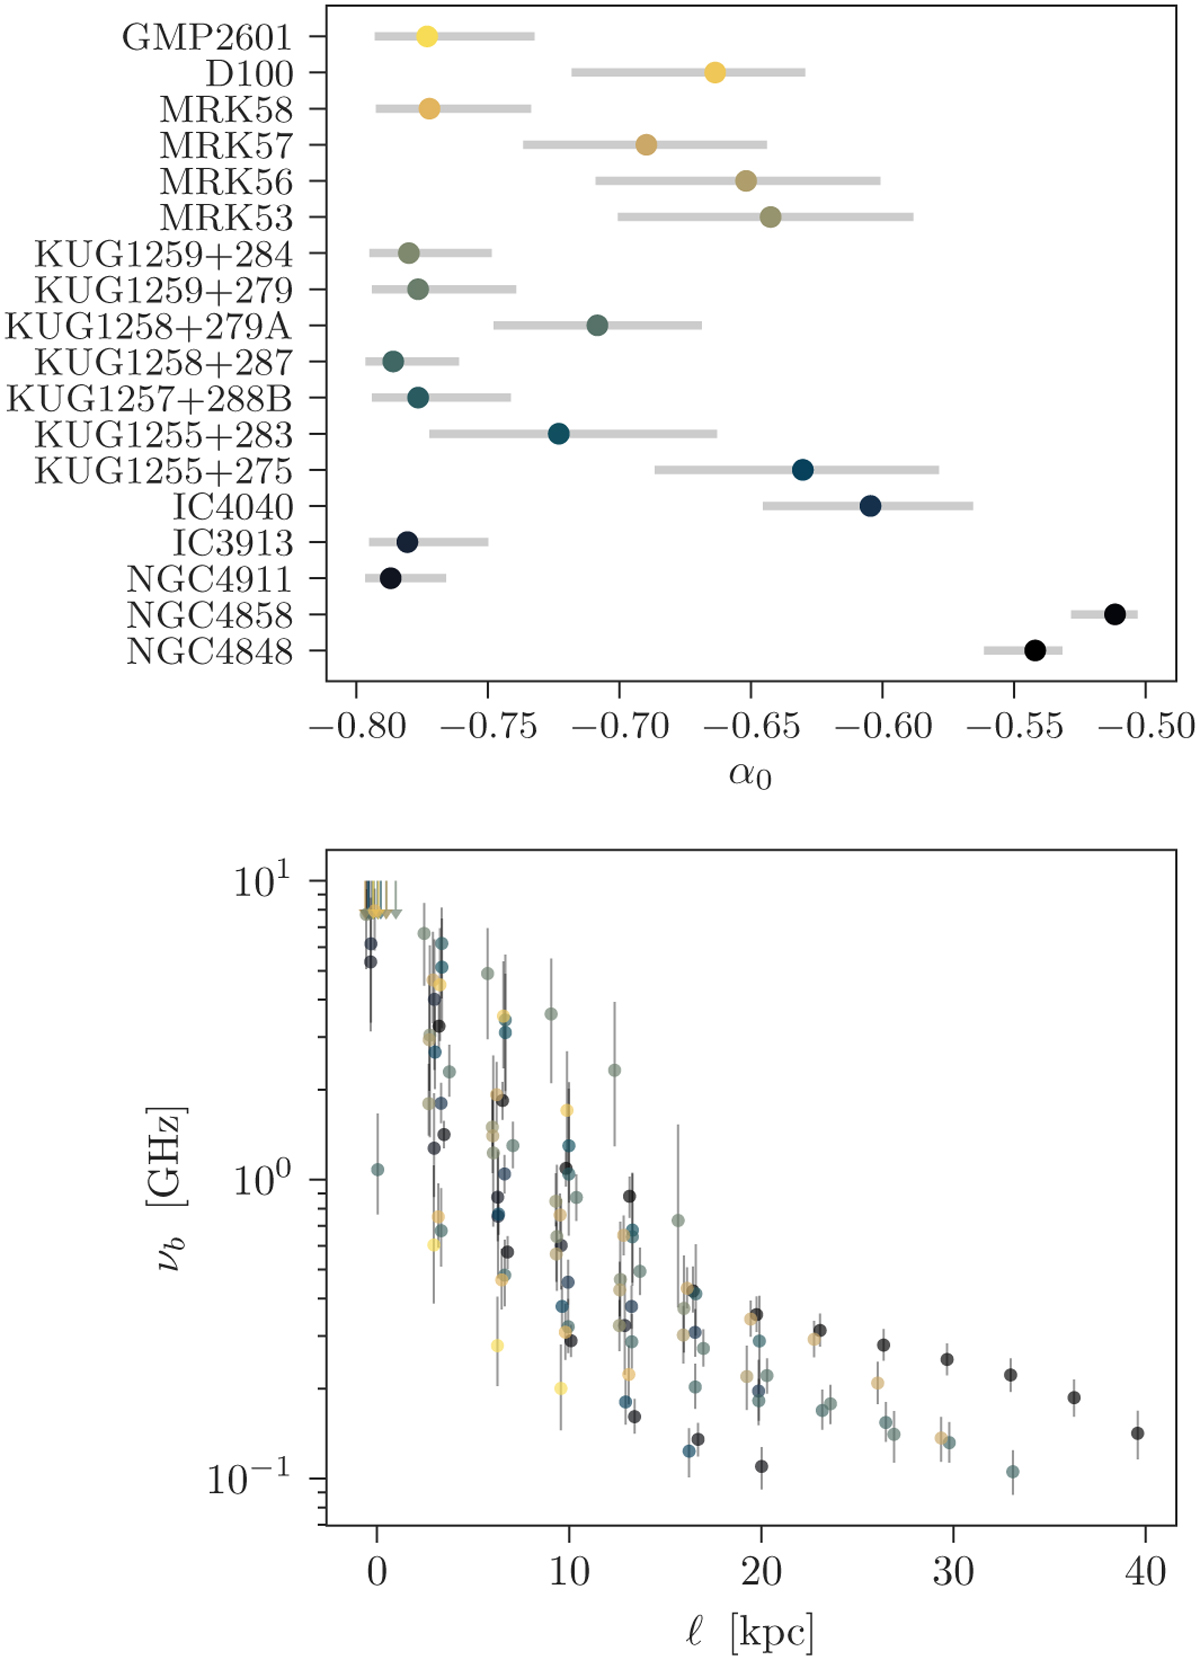
Best-fit parameters from the ageing model fits to the stripped tails. Data points are coloured according to galaxy and are consistent between panels. Top: distribution of best-fit injection spectral indices on a galaxy-by-galaxy basis. Error bars correspond to 68% credible regions from the posterior distribution. Bottom: best-fit break frequency as a function of distance along the tail. Each marker corresponds to a single measurement for an individual galaxy, and error bars span the 68% credible region. In the ℓ = 0 bin, upper limits correspond to galaxies with purely power-law spectra and are shown at vb = 10 GHz, which is the upper limit of our prior distribution. To improve readability, in each distance bin data points are randomly shifted along the x-axis according to a Gaussian distribution with µ = 0 and σ = 0.5 kpc.
Current usage metrics show cumulative count of Article Views (full-text article views including HTML views, PDF and ePub downloads, according to the available data) and Abstracts Views on Vision4Press platform.
Data correspond to usage on the plateform after 2015. The current usage metrics is available 48-96 hours after online publication and is updated daily on week days.
Initial download of the metrics may take a while.