Fig. 7
Download original image
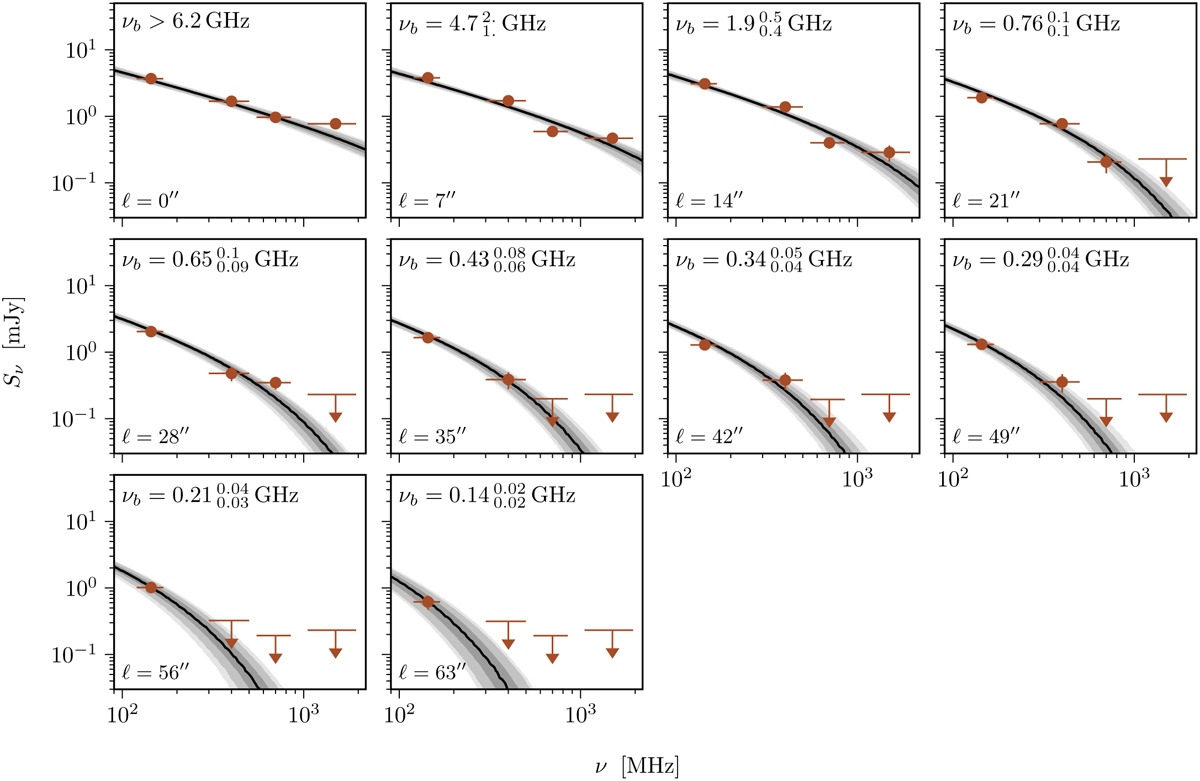
Radio continuum spectra and best-fit ageing model along the stripped tail of MRK0057. Data points show observed flux densities, and the solid black line shows the best-fit (median) ageing model along with the 84, 95, and 99.7% credible regions (shading). Error bars on flux densities are determined following the procedure outlined in Sect. 3, and error bars on the frequency axis correspond to the bandwidth of the observing band. If significant (>3σ) flux density is not detected in an aperture, we show 3σ upper limits. We list the best-fit break frequency (vb) as well as the distance along the stripped tail (ℓ) in each panel.
Current usage metrics show cumulative count of Article Views (full-text article views including HTML views, PDF and ePub downloads, according to the available data) and Abstracts Views on Vision4Press platform.
Data correspond to usage on the plateform after 2015. The current usage metrics is available 48-96 hours after online publication and is updated daily on week days.
Initial download of the metrics may take a while.