Open Access
Fig. 5
Download original image
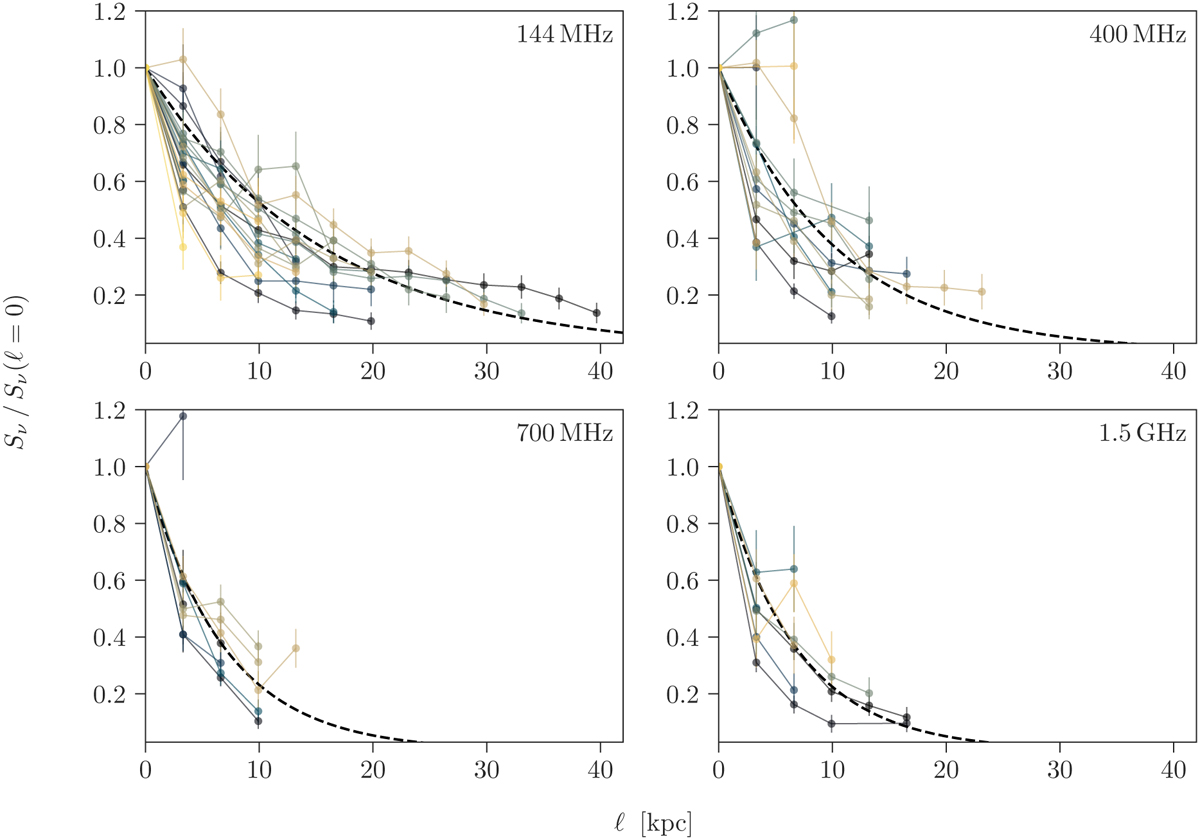
Normalized flux-density radial profiles along the stripped tails. Each solid line and markers correspond to an individual galaxy in the sample. Line colours for individual galaxies are consistent across the four panels. The dashed line in each panel shows the best-fit exponential decline for each frequency band.
Current usage metrics show cumulative count of Article Views (full-text article views including HTML views, PDF and ePub downloads, according to the available data) and Abstracts Views on Vision4Press platform.
Data correspond to usage on the plateform after 2015. The current usage metrics is available 48-96 hours after online publication and is updated daily on week days.
Initial download of the metrics may take a while.