Fig. 4
Download original image
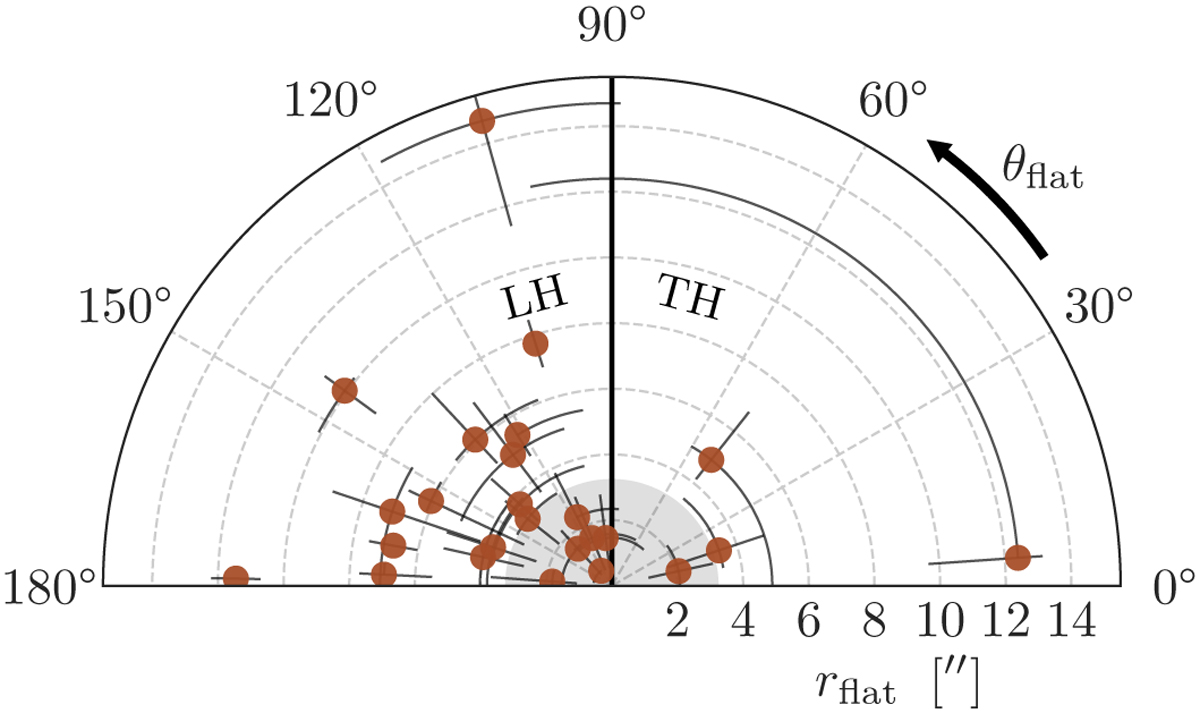
Location of the peak (i.e. flattest) spectral index within each disc, relative to the direction of the radio tail, in polar coordinates. The azimuthal axis shows θflat, and the radial axis shows rflat (see the main text for details). The shaded region corresponds to 3.25″, the half width at half maximum of the beam. Angles greater than 90° correspond to points on the leading half (LH), and angles less than 90° correspond to points on the trailing half (TH). The peak spectral index is systematically found on the leading half (θflat > 0) of ram-pressure-stripped galaxies.
Current usage metrics show cumulative count of Article Views (full-text article views including HTML views, PDF and ePub downloads, according to the available data) and Abstracts Views on Vision4Press platform.
Data correspond to usage on the plateform after 2015. The current usage metrics is available 48-96 hours after online publication and is updated daily on week days.
Initial download of the metrics may take a while.