Fig. 3
Download original image
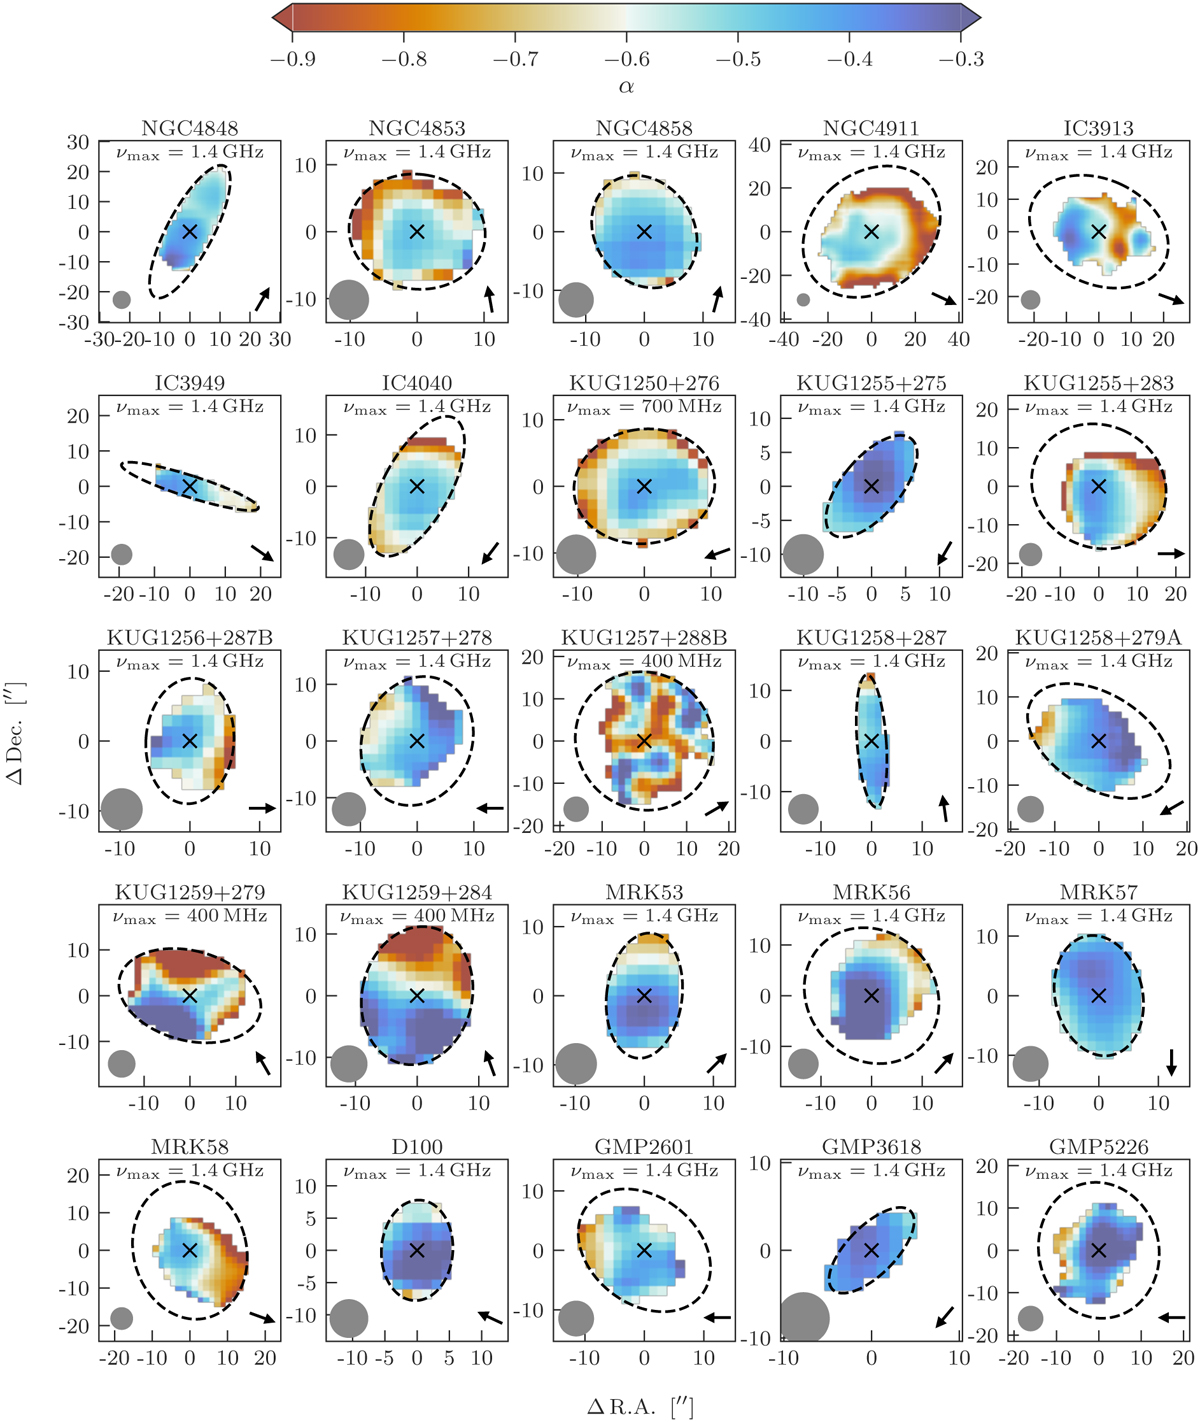
Spectral index maps for each galaxy disc in our sample. Spectral indices are measured between 144 MHz and νmax, as listed in each figure panel. The dashed ellipse in each panel corresponds to the r-band Petrosian 90% radius, the ‘x’ marks the optical galaxy centre, and the filled circle shows the 6.5″ beam FWHM. In the lower right of each panel, we show an arrow that points in the projected direction of the stripped tail. The typical uncertainties on the spectral index maps are ~0.05 between 144 MHz and 1.5 GHz, ~0.07 between 144 and 700 MHz, and ~0.11 between 144 and 400 MHz.
Current usage metrics show cumulative count of Article Views (full-text article views including HTML views, PDF and ePub downloads, according to the available data) and Abstracts Views on Vision4Press platform.
Data correspond to usage on the plateform after 2015. The current usage metrics is available 48-96 hours after online publication and is updated daily on week days.
Initial download of the metrics may take a while.