Fig. 2
Download original image
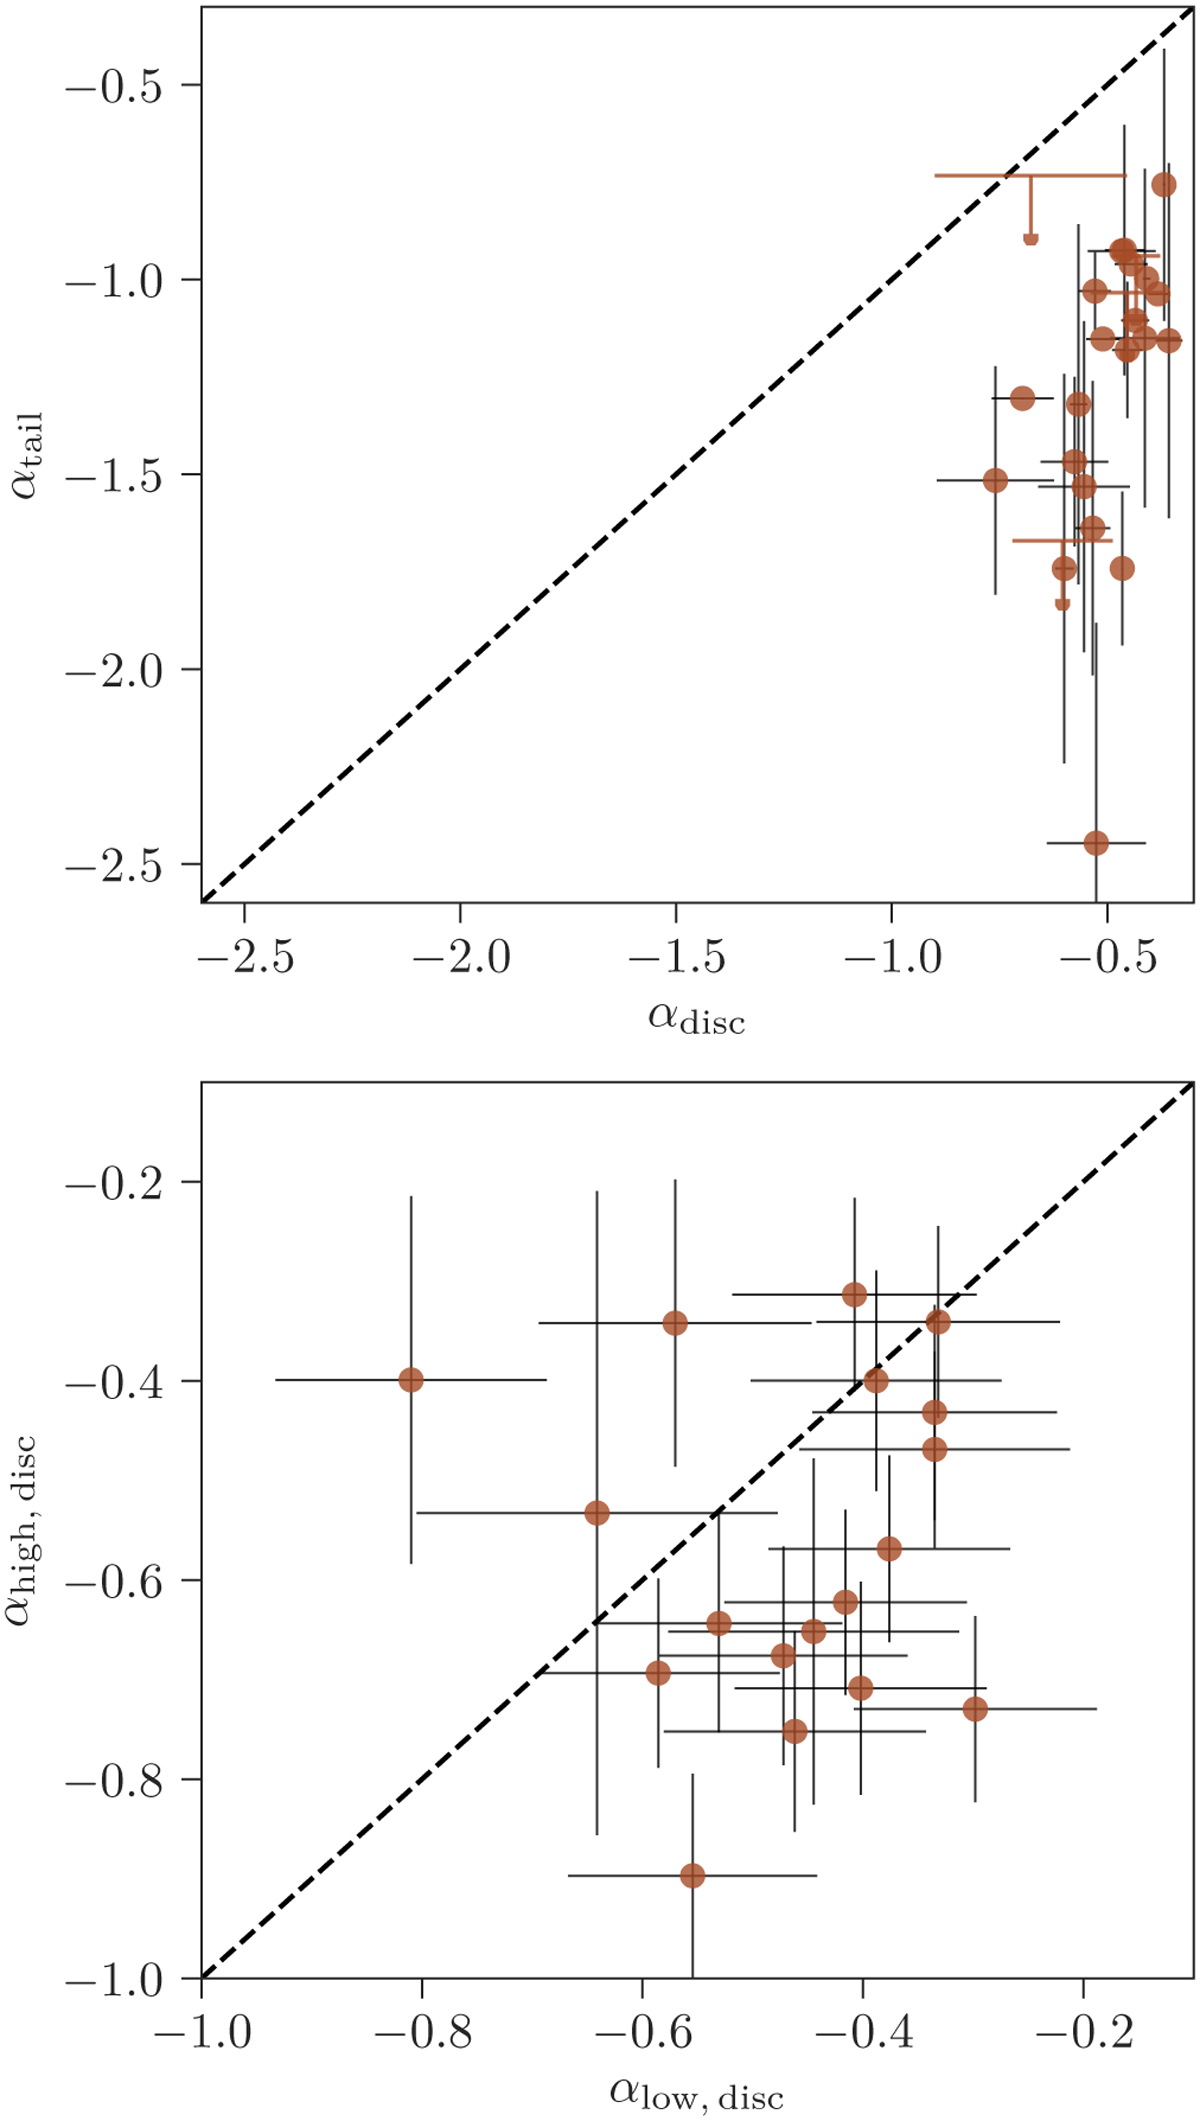
Integrated spectral index measurements. Top: tail spectral index versus galaxy disc spectral index. When emission is detected in three or more frequency bands, the spectral index and its error are determined from orthogonal distance regression fits. When emission is only detected in two frequency bands, the spectral index and its error are determined via the direct method (Eq. (1)). For galaxies where emission in the tail is only detected at one frequency (see Table 2), αtail is shown as a 3σ upper limit. Bottom: radio colour-colour diagram for the galaxy discs. The high-frequency spectral index (y-axis) is measured between 700 MHz and 1.5 GHz, and the low-frequency spectral index (x-axis) is measured between 144 and 400 MHz. In both the top and bottom panels, the dashed lines correspond to the one-to-one relation.
Current usage metrics show cumulative count of Article Views (full-text article views including HTML views, PDF and ePub downloads, according to the available data) and Abstracts Views on Vision4Press platform.
Data correspond to usage on the plateform after 2015. The current usage metrics is available 48-96 hours after online publication and is updated daily on week days.
Initial download of the metrics may take a while.