Fig. 1
Download original image
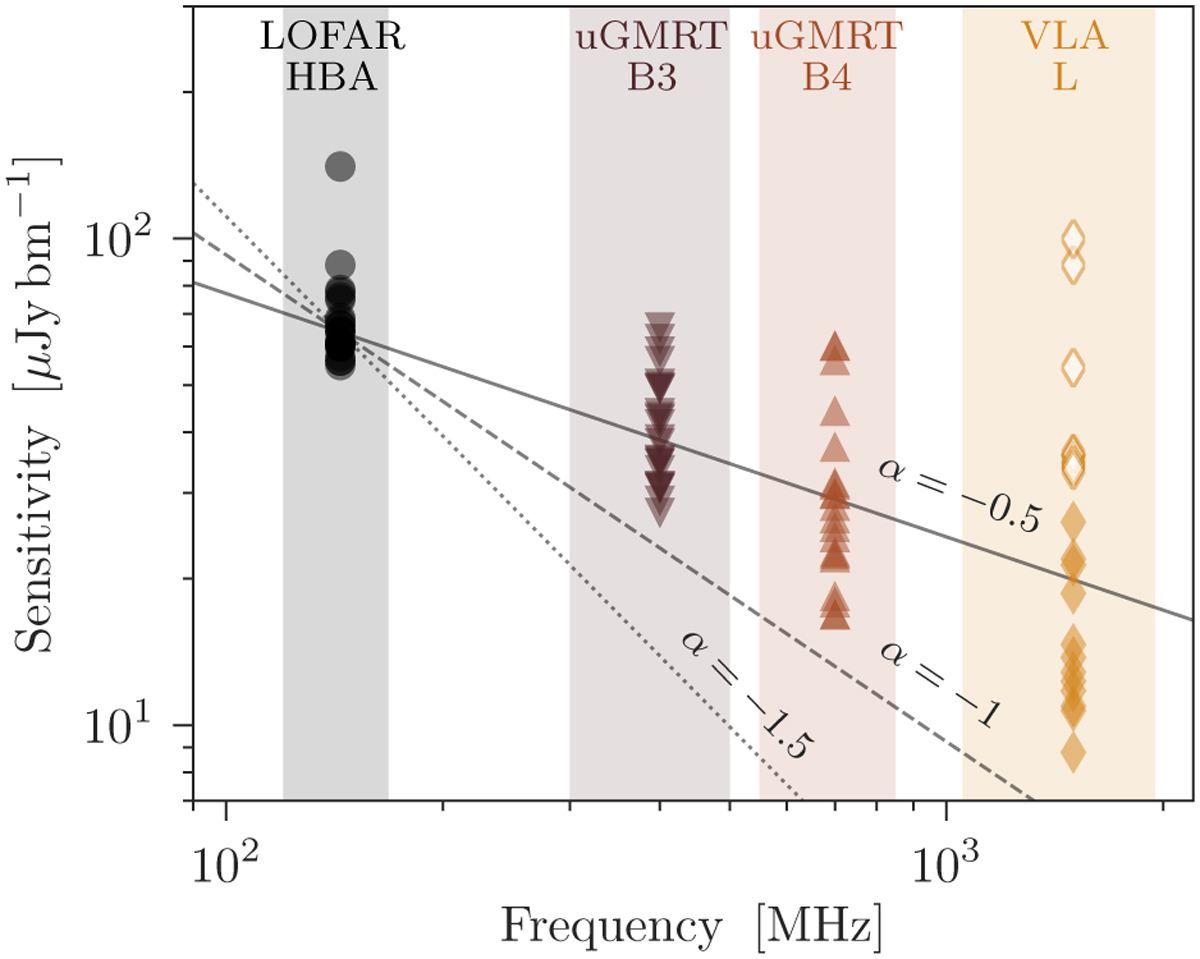
One-sigma sensitivity (rms) as a function of frequency for each of the observing bands in this work. All values are measured from images at our working resolution of 6.5″. Data points correspond to the local rms measured around each galaxy. For the L band, the filled markers correspond to galaxies that are covered by the Chen et al. (2020) observations and the open markers correspond to galaxies only covered by the Miller et al. (2009a) observations. Shaded bands correspond to the width of each observing band. For reference, we plot lines corresponding to spectral indices of −0.5, −1, and −1.5 anchored to the lowest-frequency band.
Current usage metrics show cumulative count of Article Views (full-text article views including HTML views, PDF and ePub downloads, according to the available data) and Abstracts Views on Vision4Press platform.
Data correspond to usage on the plateform after 2015. The current usage metrics is available 48-96 hours after online publication and is updated daily on week days.
Initial download of the metrics may take a while.