Fig. 5.
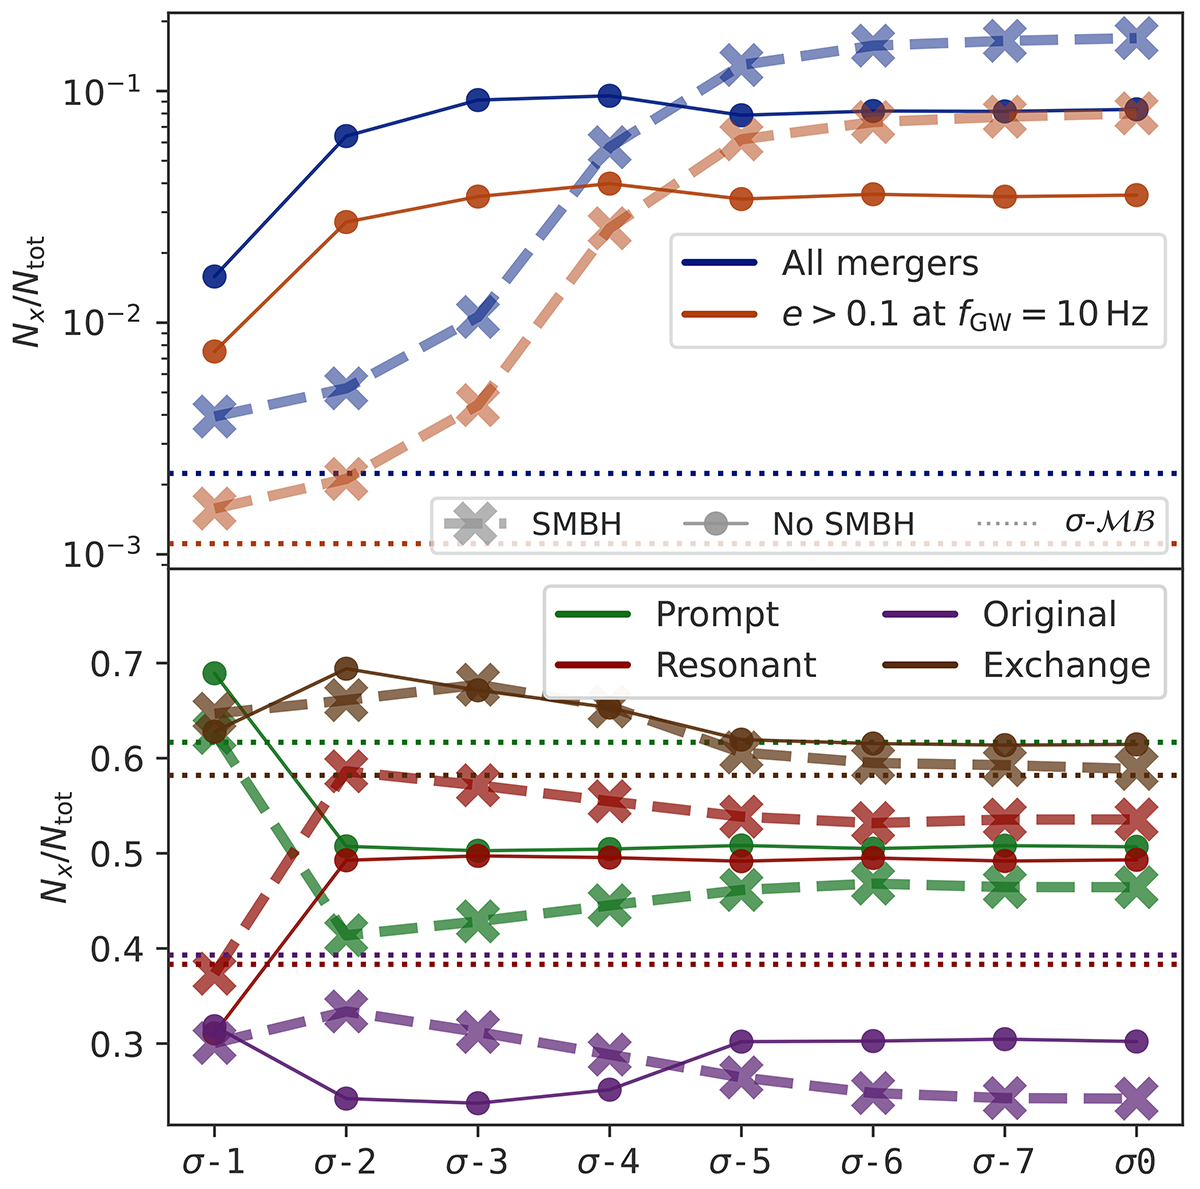
Download original image
Fraction of outcomes for each set of simulations. The velocity dispersion decreases from left to right, and goes from σ = 10−1 to σ = 0. The solid lines with circle markers are the simulation in isolation (σn-i). The dashed lines with cross markers indicate the simulations with the SMBH (σn). The horizontal dotted lines indicate the results for σ-ℳℬ. The top panel shows the fraction of mergers (blue lines) and the fraction of mergers with high eccentricity at fGW = 10 Hz (orange lines). The bottom panel shows the fraction of prompt (green lines) and resonant (red lines) interactions, and the fraction of encounters ending with the original binary (purple lines) or with an exchanged member (brown lines).
Current usage metrics show cumulative count of Article Views (full-text article views including HTML views, PDF and ePub downloads, according to the available data) and Abstracts Views on Vision4Press platform.
Data correspond to usage on the plateform after 2015. The current usage metrics is available 48-96 hours after online publication and is updated daily on week days.
Initial download of the metrics may take a while.