Open Access
Fig. 4
Download original image
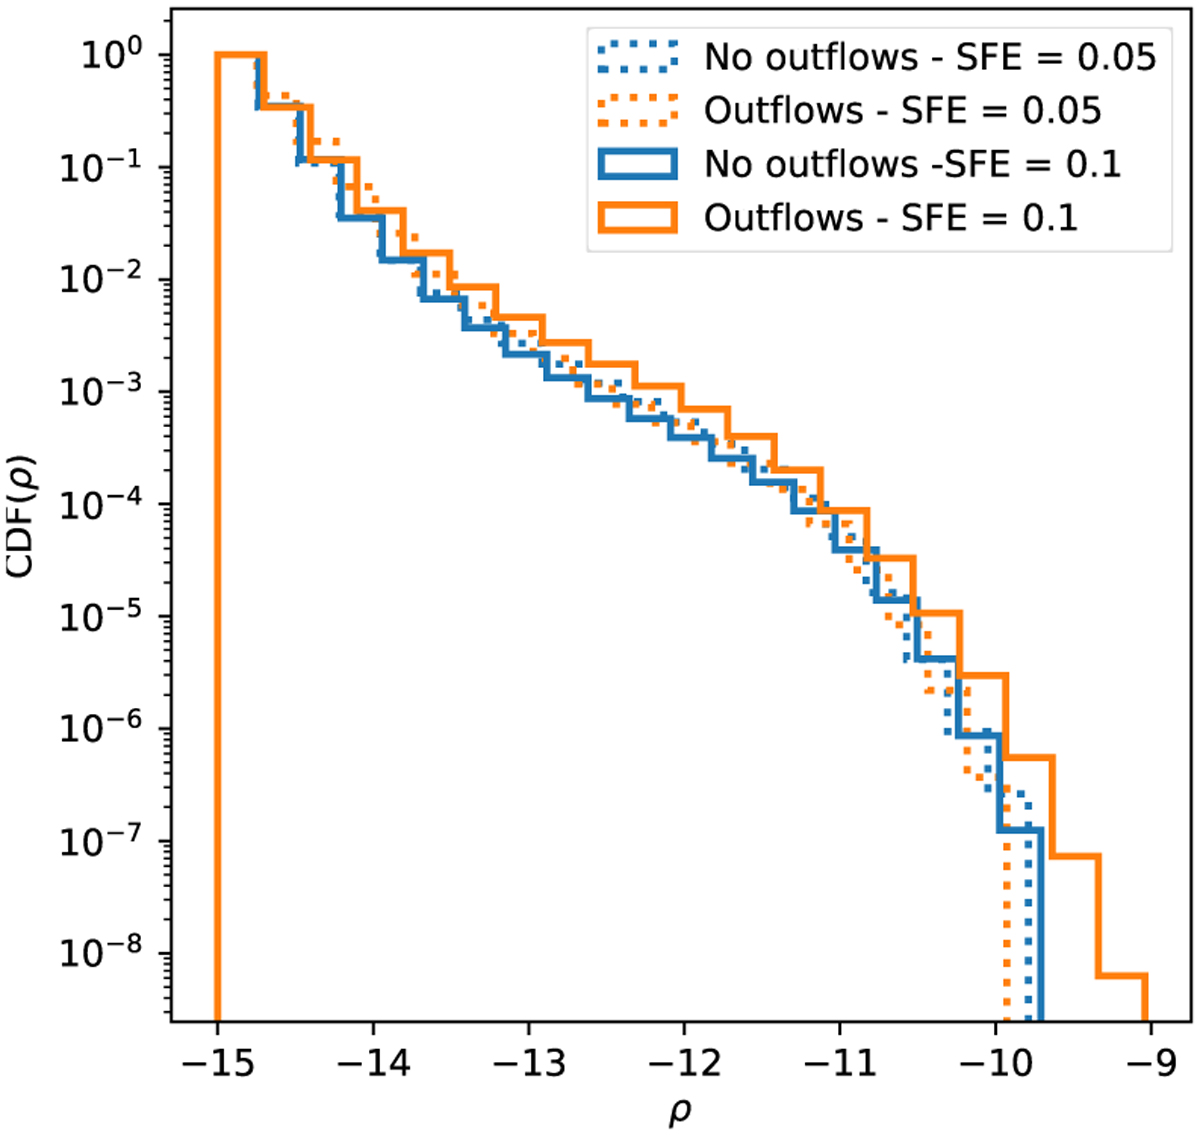
Inverse cumulative distribution function of ρ for the dense gas (for r > 10−15g cm−3) outside the main star cluster, that is, for r > 0.1 pc for both models at SFE=0.05 (dotted lines) and SFE=0.1 (plain lines). One can clearly see that the outflows promote fragmentation between SFE=0.05 and SFE=0.1.
Current usage metrics show cumulative count of Article Views (full-text article views including HTML views, PDF and ePub downloads, according to the available data) and Abstracts Views on Vision4Press platform.
Data correspond to usage on the plateform after 2015. The current usage metrics is available 48-96 hours after online publication and is updated daily on week days.
Initial download of the metrics may take a while.