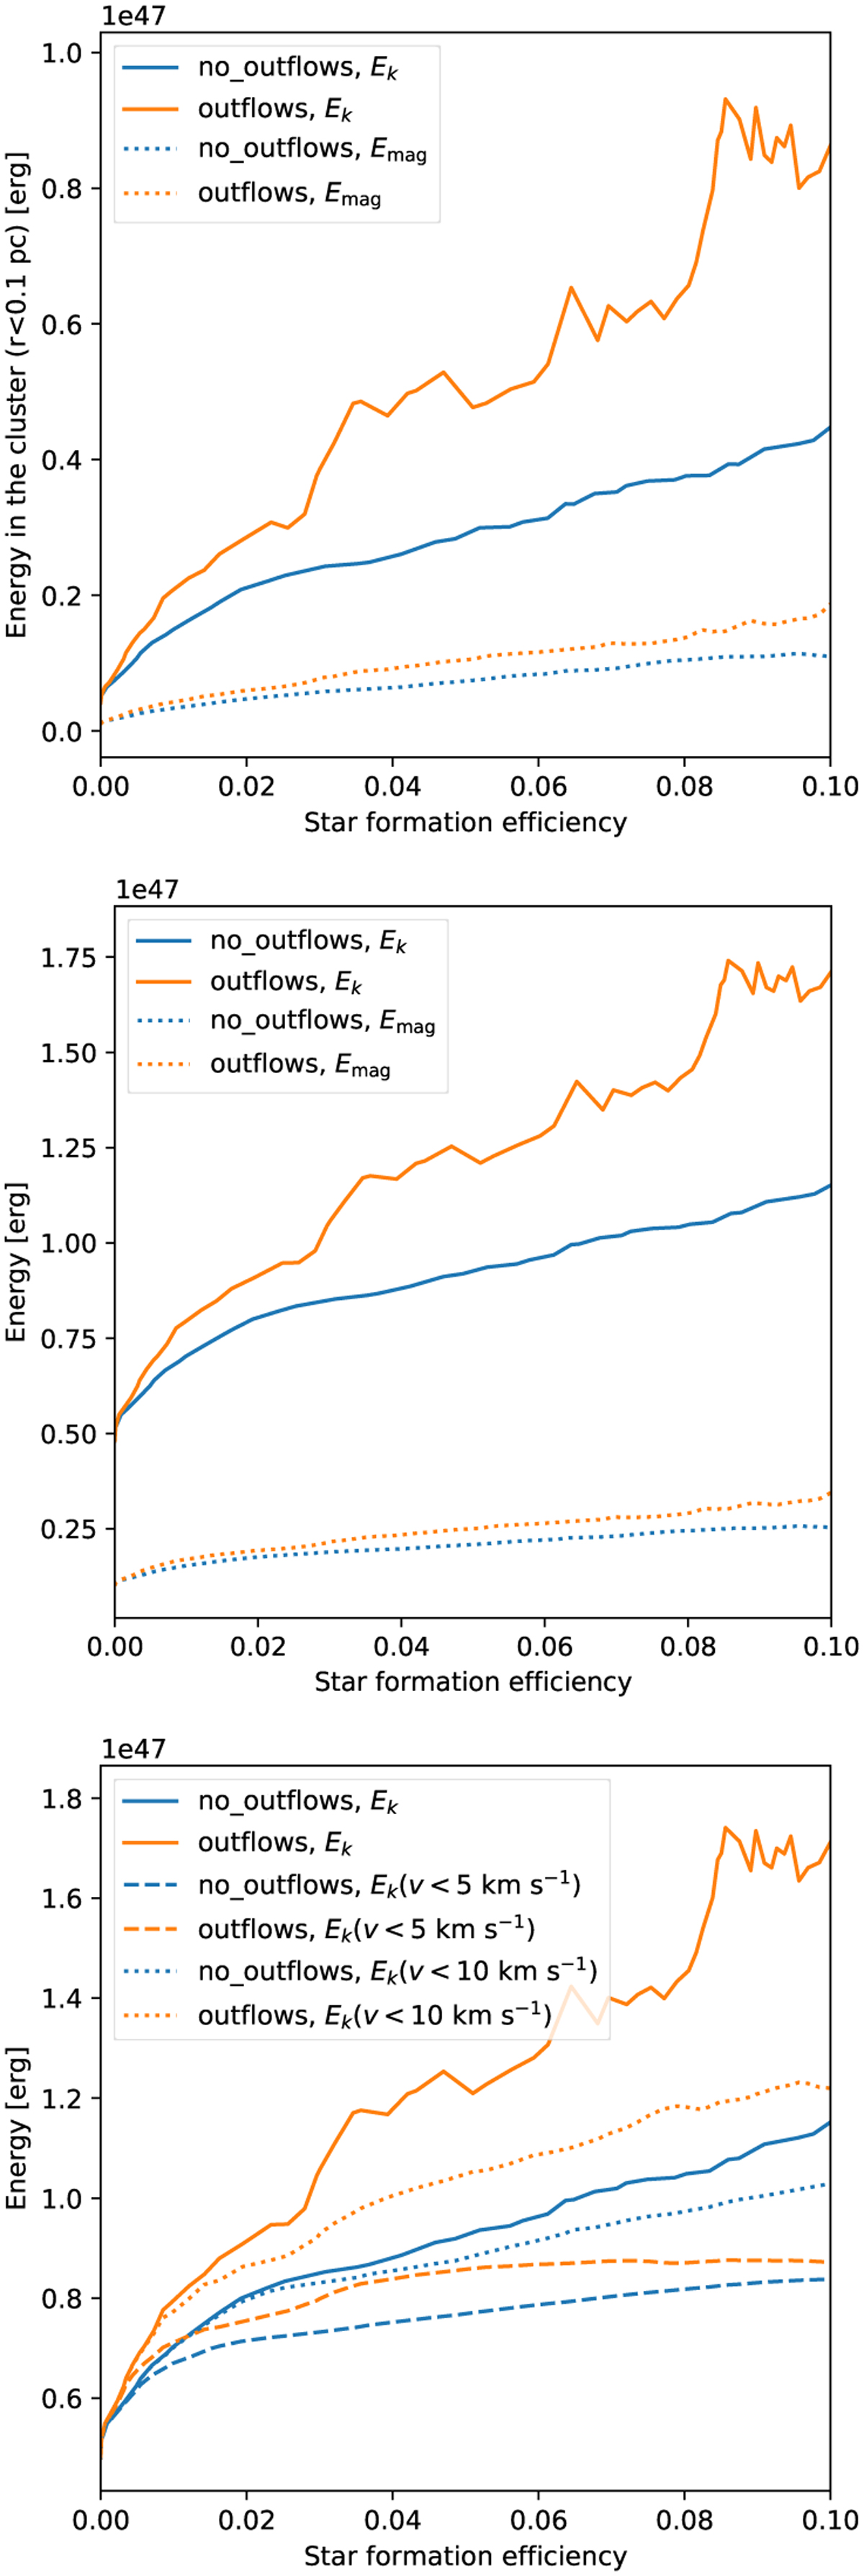
Fig. 3
Download original image
Evolution of the energy for the two models. The top and middle plots show the kinetic (plain lines) and magnetic (dotted lines) energies as a function of SFE for the two models in a sphere of 0.1 pc surrounding the main cluster (top) and in the full clump (middle). As can be seen, outflows increase the overall support of the cloud, as both the kinetic and magnetic energy are larger in their presence. The bottom plots show the kinetic energy in the cluster with various velocity thresholds. We observed that outflows essentially add kinetic energy in a fast v > 10 km s−1 component.
Current usage metrics show cumulative count of Article Views (full-text article views including HTML views, PDF and ePub downloads, according to the available data) and Abstracts Views on Vision4Press platform.
Data correspond to usage on the plateform after 2015. The current usage metrics is available 48-96 hours after online publication and is updated daily on week days.
Initial download of the metrics may take a while.