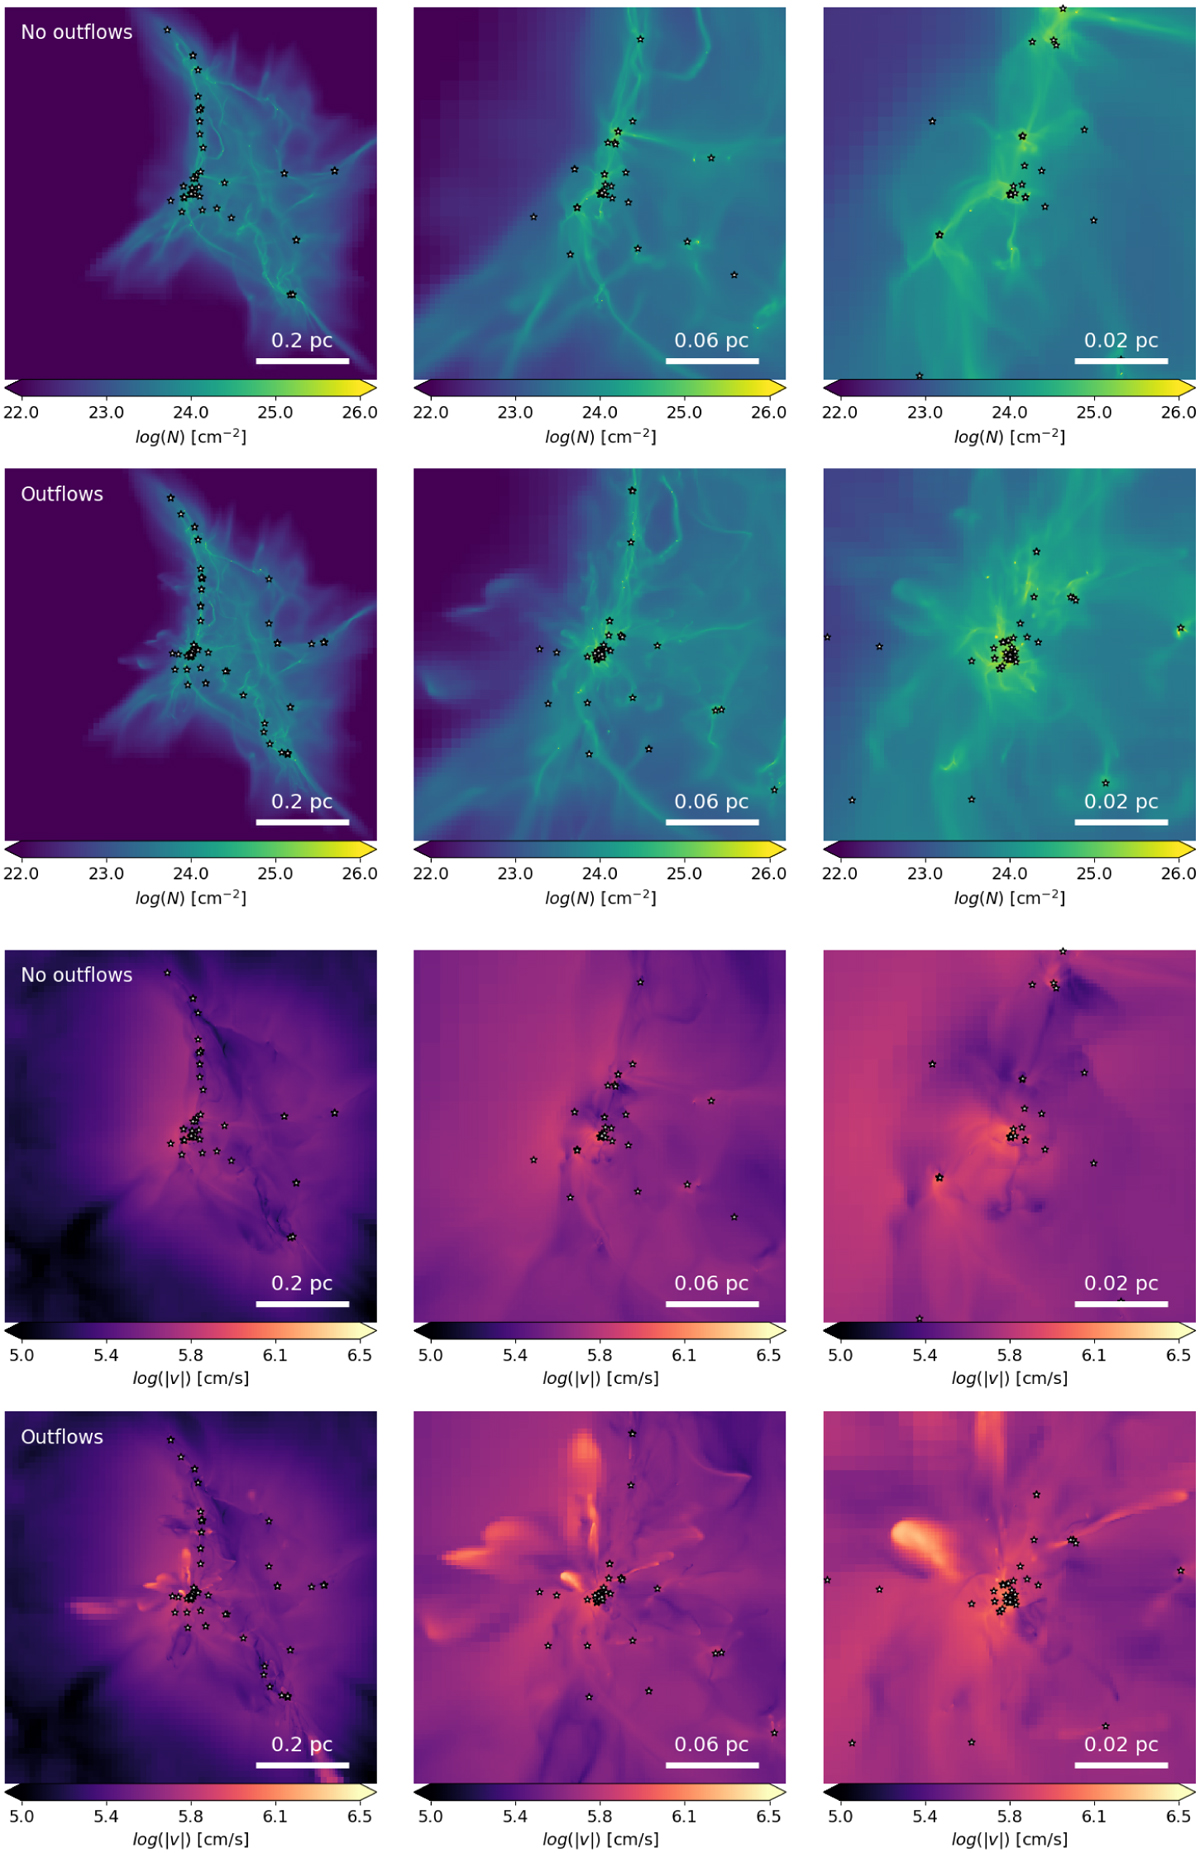
Fig. 2
Download original image
Evolution of the star-forming clump. Top 6 maps: (x−y) column density maps of the two models integrated along the z direction at SFE=0.1. The top map shows the model without protostellar outflows. The bottom map shows the model with protostellar outflows. From left to right: we zoom toward sink 1, that is, near the center of the collapse. The outflows have a visible impact on the column density structures at scales below 0.1 pc. Clearly, more stars form in the presence of the outflows. Bottom 6 maps: same but for the mass weighted norm of the velocity. The outflows significantly modify the velocity field at scales smaller than 0.1 pc.
Current usage metrics show cumulative count of Article Views (full-text article views including HTML views, PDF and ePub downloads, according to the available data) and Abstracts Views on Vision4Press platform.
Data correspond to usage on the plateform after 2015. The current usage metrics is available 48-96 hours after online publication and is updated daily on week days.
Initial download of the metrics may take a while.