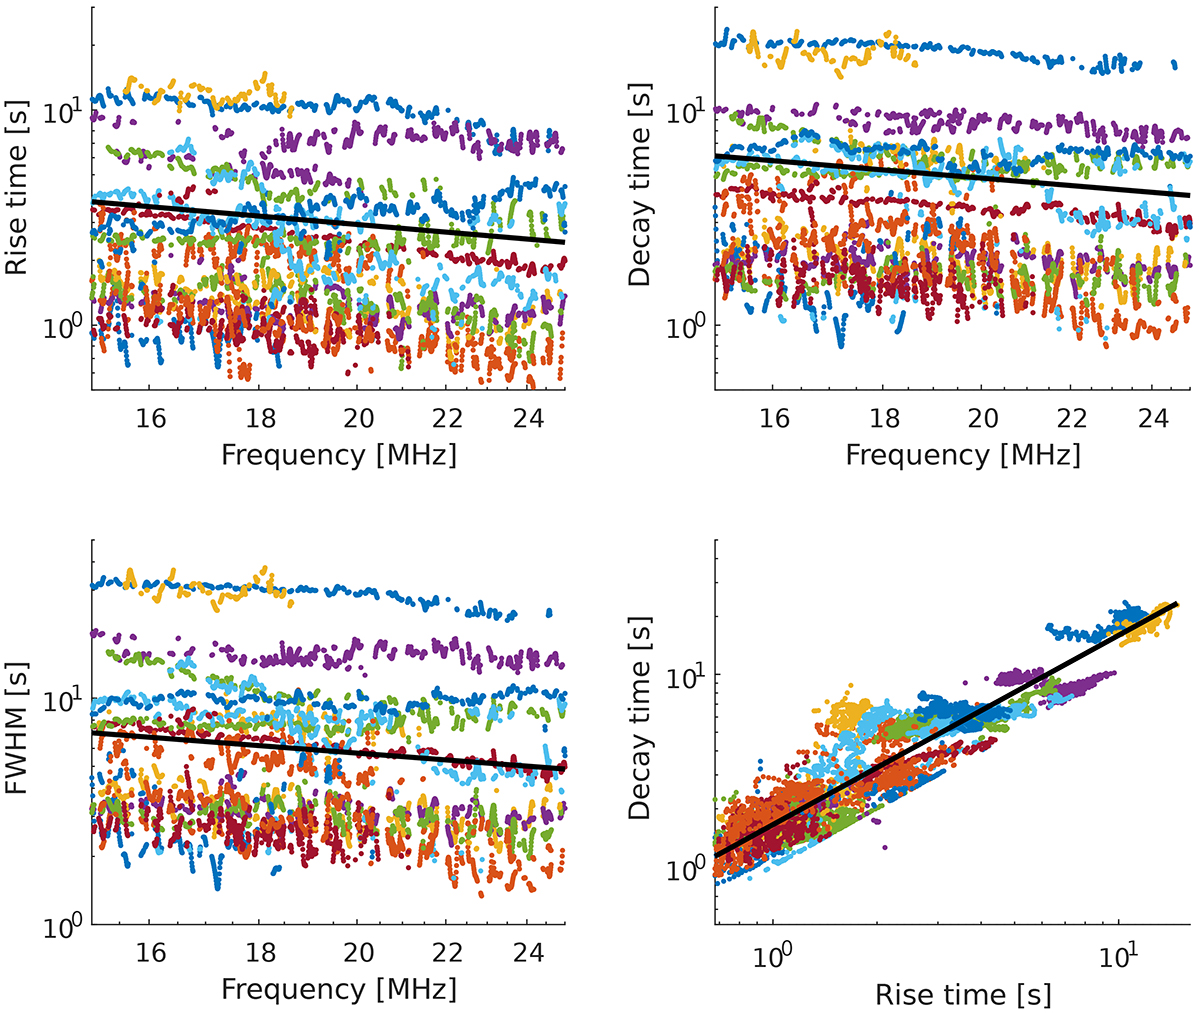
Fig. 8.
Download original image
Analysis of rise time and decay time of the suitable type III bursts recorded by SHARAD after fitting an exponentially modified Gaussian function onto every frequency line that is unhampered by EMI. The colour-coding of the dots represents profiles from an individual burst, with some colours being reused. The black line is the best power-law fit, the equations for which are given in formulae (13) through (16).
Current usage metrics show cumulative count of Article Views (full-text article views including HTML views, PDF and ePub downloads, according to the available data) and Abstracts Views on Vision4Press platform.
Data correspond to usage on the plateform after 2015. The current usage metrics is available 48-96 hours after online publication and is updated daily on week days.
Initial download of the metrics may take a while.