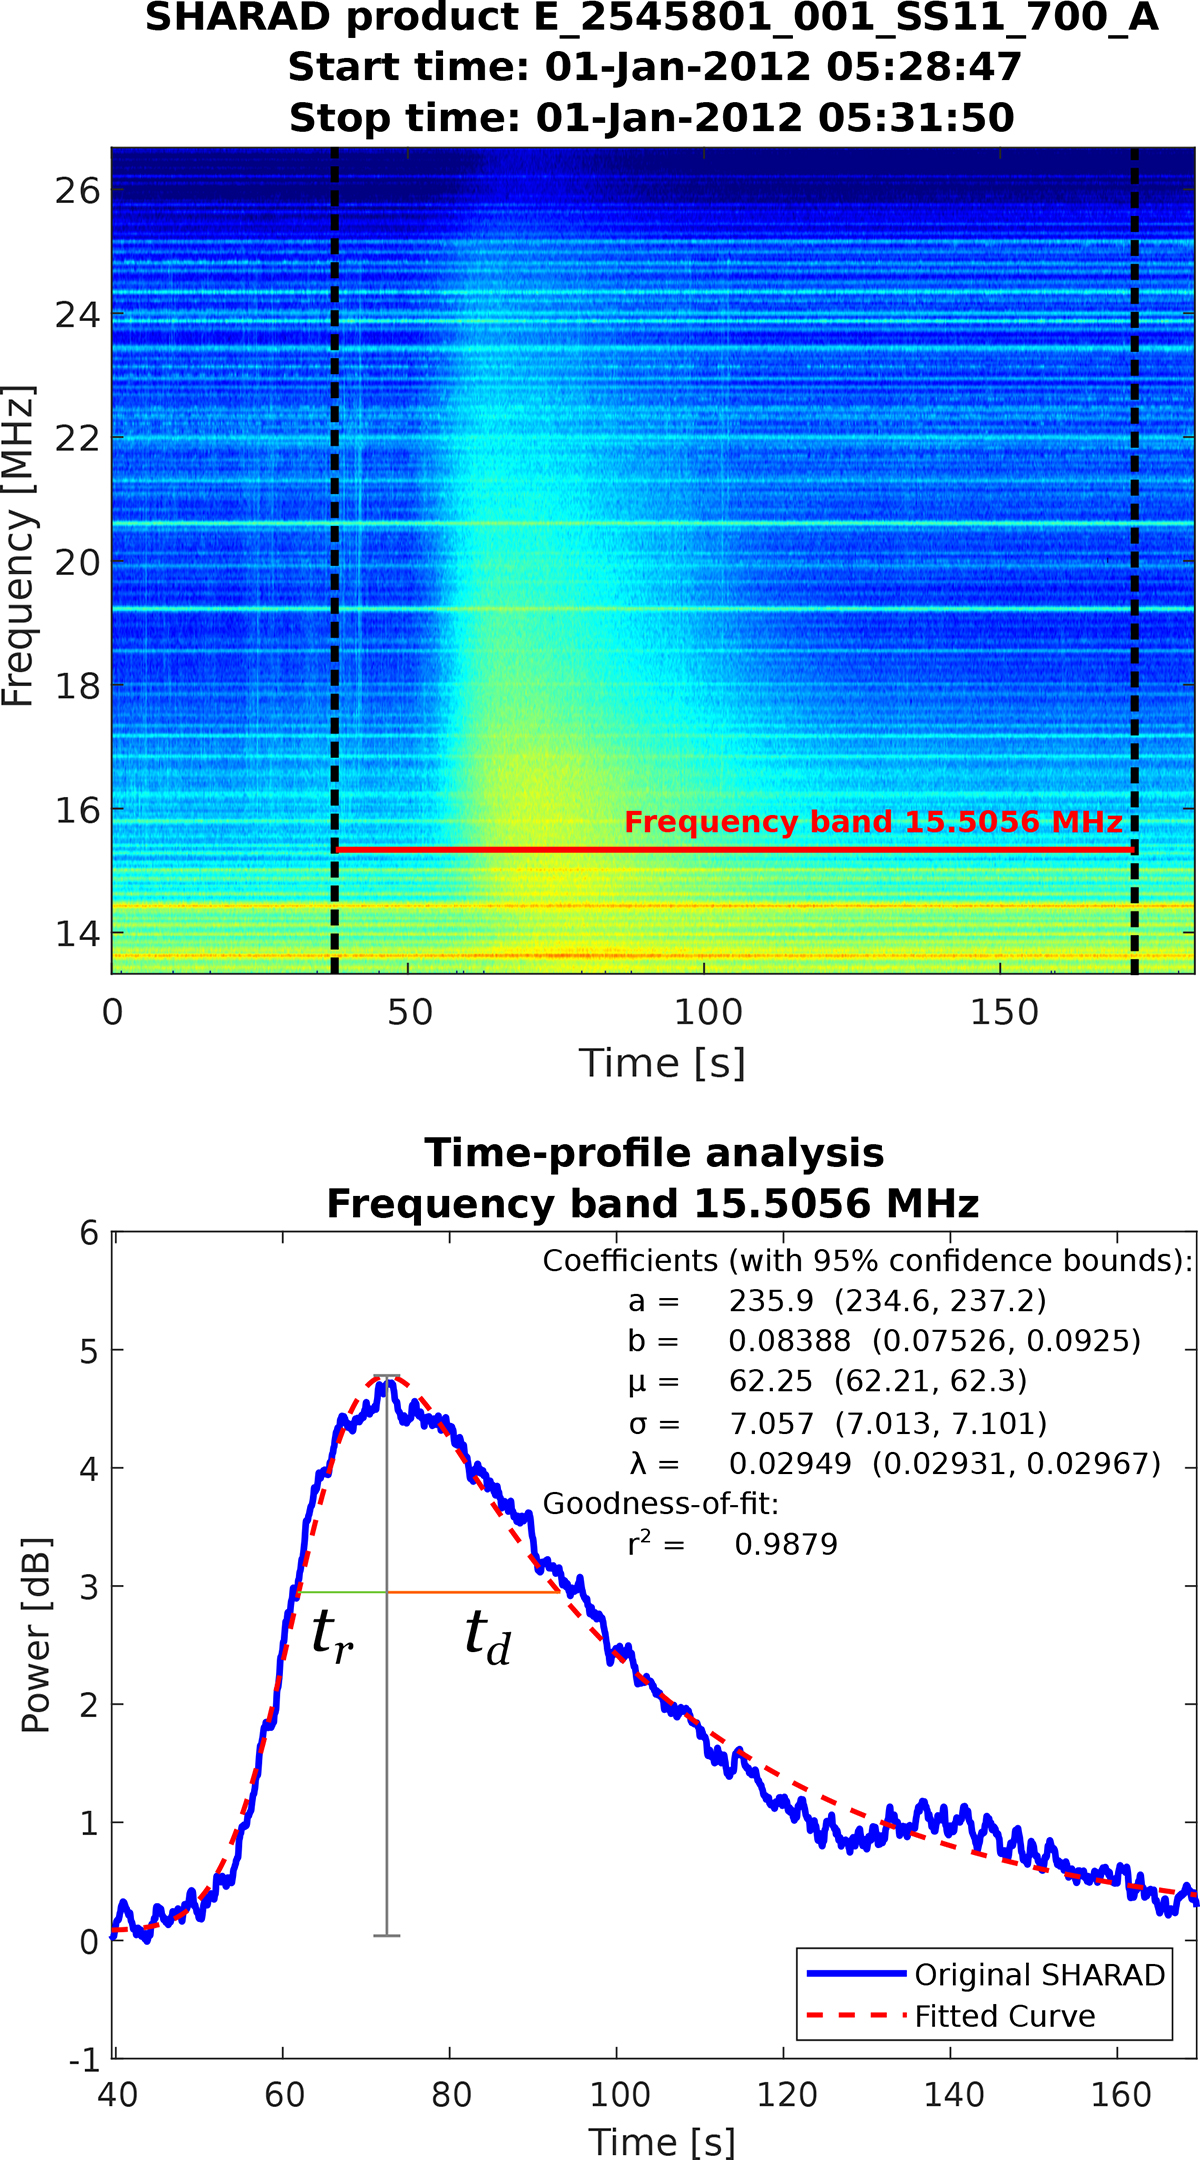
Fig. 7.
Download original image
Example of a time-profile extraction and fit on SHARAD product 2545801 using the EMI-free frequency band of 15.5056 MHz. The dashed vertical black lines on the dynamic spectrum represent the portion of the product that was fed into the fitting subroutine. The coefficients displayed next to the fitted curve correspond directly to those of Eq. (11). The rise and decay time tr and td were derived as the first and second HWHM. The maximum was computed as the difference between the maximum of the curve and the floor parameter b.
Current usage metrics show cumulative count of Article Views (full-text article views including HTML views, PDF and ePub downloads, according to the available data) and Abstracts Views on Vision4Press platform.
Data correspond to usage on the plateform after 2015. The current usage metrics is available 48-96 hours after online publication and is updated daily on week days.
Initial download of the metrics may take a while.