Fig. 6.
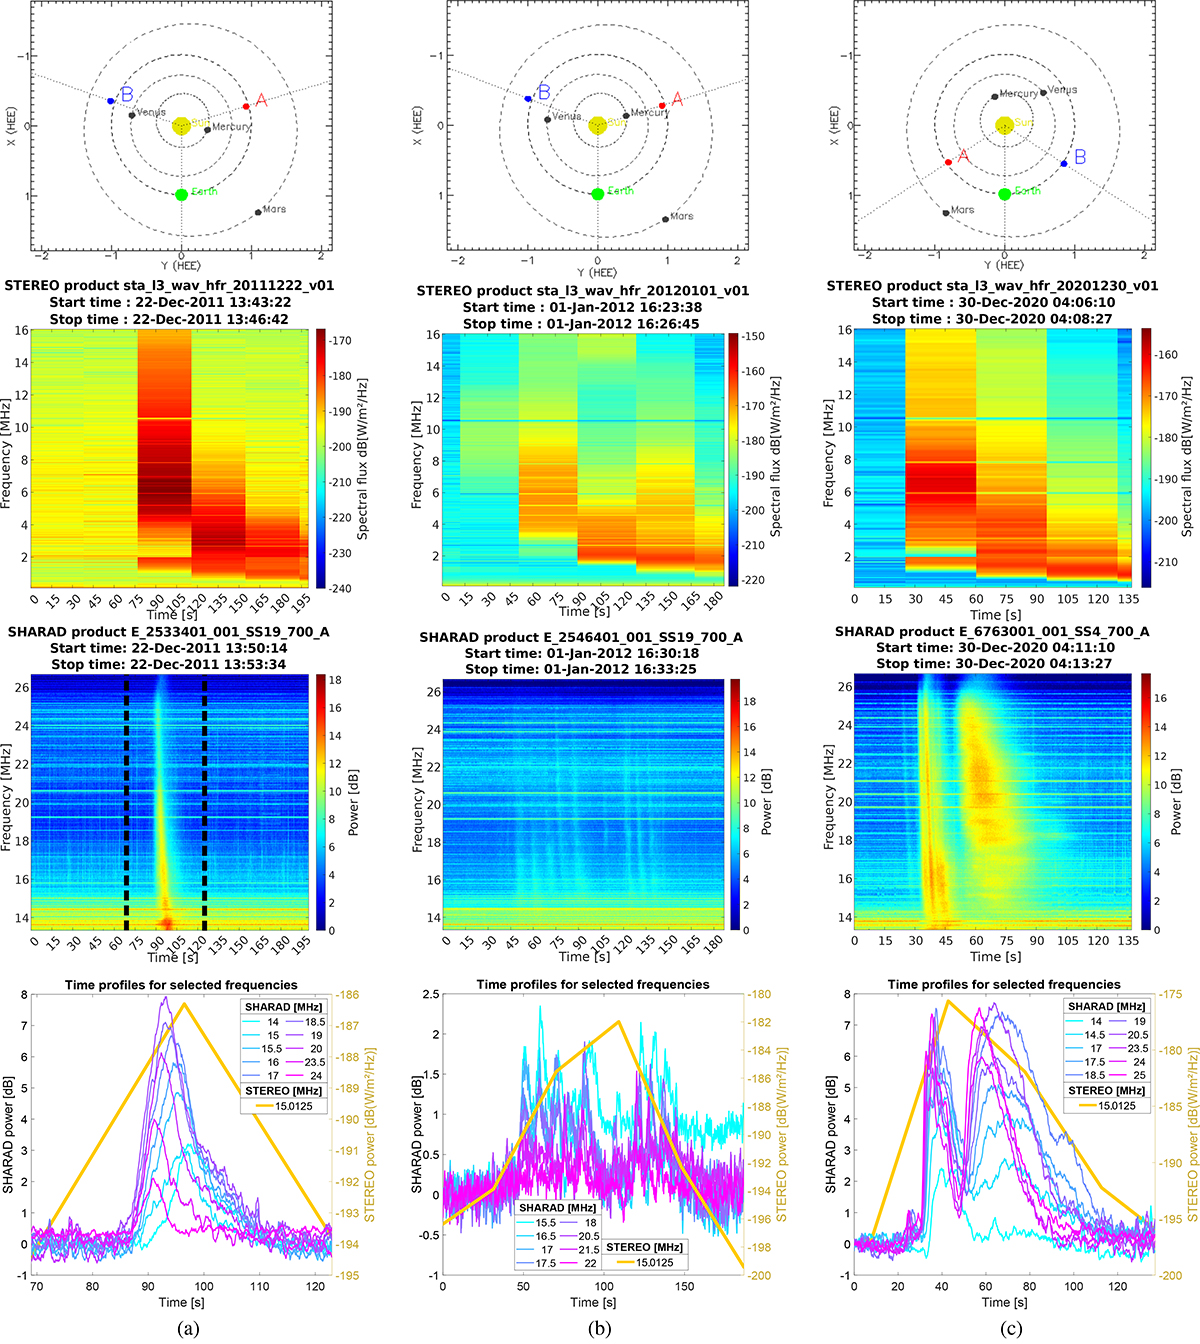
Download original image
In-depth analysis of three representative elements of the SHARAD burst dataset: (a) SHARAD product 2533401, which is also displayed in Fig. 1; (b) SHARAD product 2546401; (c) SHARAD product 6763001. For each case, the plots in the first row represent a map of the Solar System. The second row shows the STEREO-captured original burst, in calibrated units. The third row shows the SHARAD spectrogram. The plots in the fourth row contain time profiles for selected frequencies extracted from the SHARAD spectrogram, along with the 15.0125 MHz line from STEREO for comparison. In the case of 2533401, the dashed black lines on the SHARAD spectrogram show the bounds of the corresponding time profiles. The calibrated STEREO data was sourced from Krupar et al. (2022).
Current usage metrics show cumulative count of Article Views (full-text article views including HTML views, PDF and ePub downloads, according to the available data) and Abstracts Views on Vision4Press platform.
Data correspond to usage on the plateform after 2015. The current usage metrics is available 48-96 hours after online publication and is updated daily on week days.
Initial download of the metrics may take a while.