Fig. 5.

Download original image
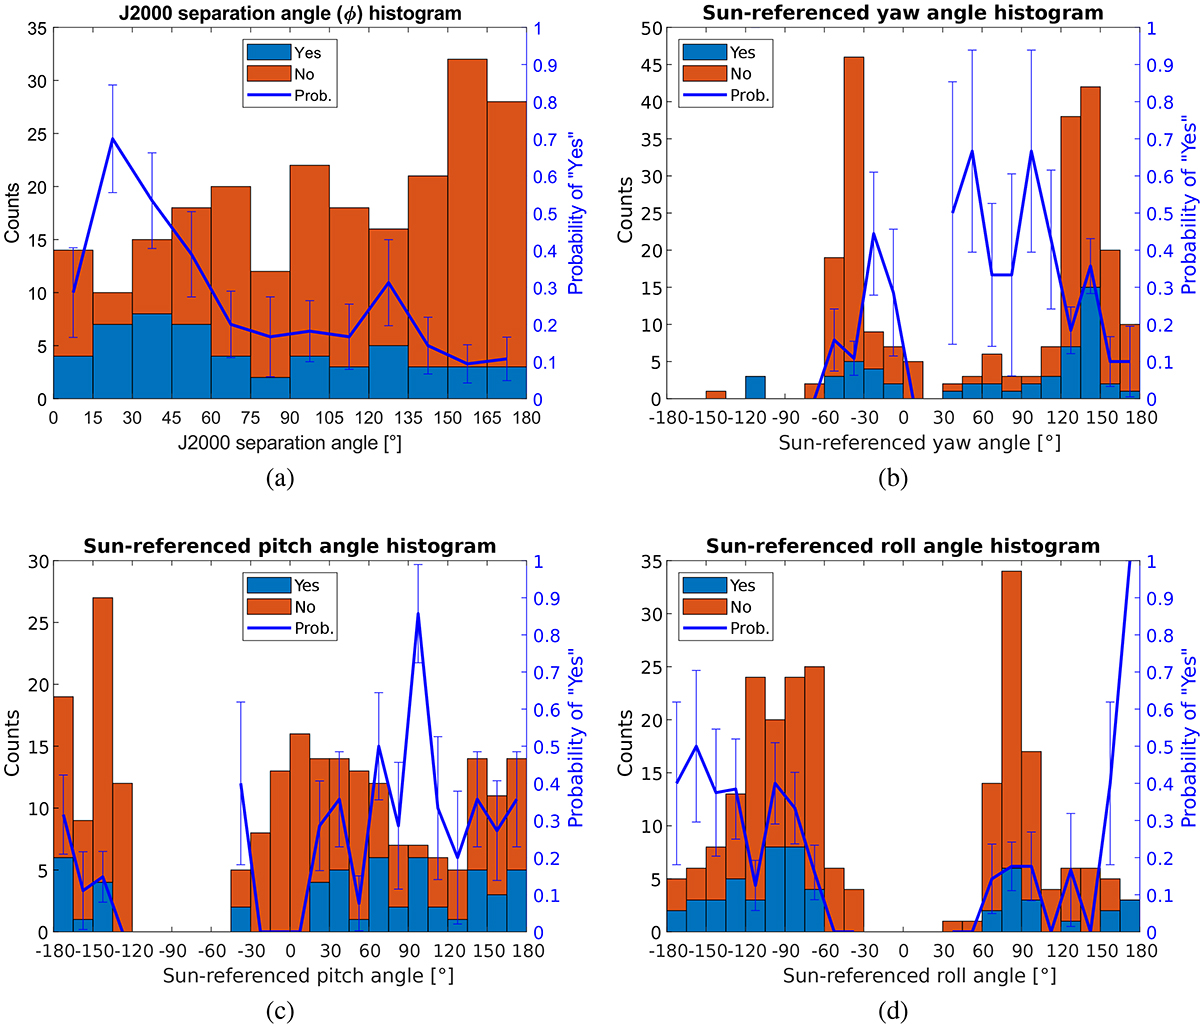
Sensitivity of SHARAD to geometrical acquisition parameters. Histograms of the number of burst detections (‘Yes’) and burst no-detections (‘No’) along with the probability p of detection (ratio of ‘Yes’ to ‘Yes’ + ‘No’) for J2000 separation, yaw, pitch, and roll angles, respectively. The bars of the histograms are stacked, meaning the total number of events n in a given angular bin is immediately accessible on the graph. The error bars associated with the probability curve correspond to the standard error of a binary outcome, that is, σ = [p(1 − p)/n]1/2.
Current usage metrics show cumulative count of Article Views (full-text article views including HTML views, PDF and ePub downloads, according to the available data) and Abstracts Views on Vision4Press platform.
Data correspond to usage on the plateform after 2015. The current usage metrics is available 48-96 hours after online publication and is updated daily on week days.
Initial download of the metrics may take a while.


