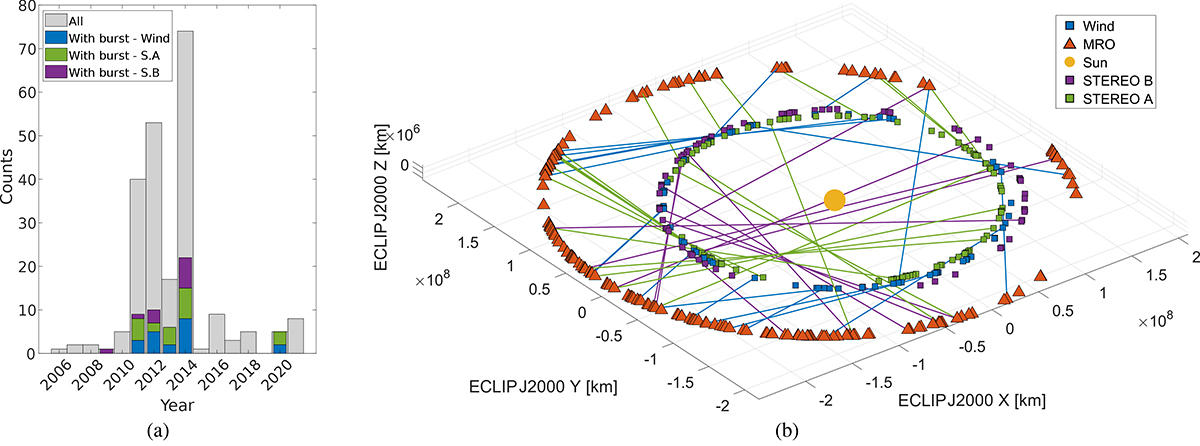
Fig. 2.
Download original image
Visual summary of the generated dataset. (a) Temporal distribution of the SHARAD burst candidates. In grey is the count of all SHARAD candidates per year, with the burst-containing subsets colour-coded according to the source of the observation. The histogram follows the solar cycle, and the proportion of burst-containing products is stable. (b) Spatial distributions of SHARAD burst candidates. Indicated are the positions of MRO, STEREO A, STEREO B, and Wind for all SHARAD candidates. The lines are drawn between the source of the observation and the corresponding SHARAD candidate for every candidate with a burst.
Current usage metrics show cumulative count of Article Views (full-text article views including HTML views, PDF and ePub downloads, according to the available data) and Abstracts Views on Vision4Press platform.
Data correspond to usage on the plateform after 2015. The current usage metrics is available 48-96 hours after online publication and is updated daily on week days.
Initial download of the metrics may take a while.