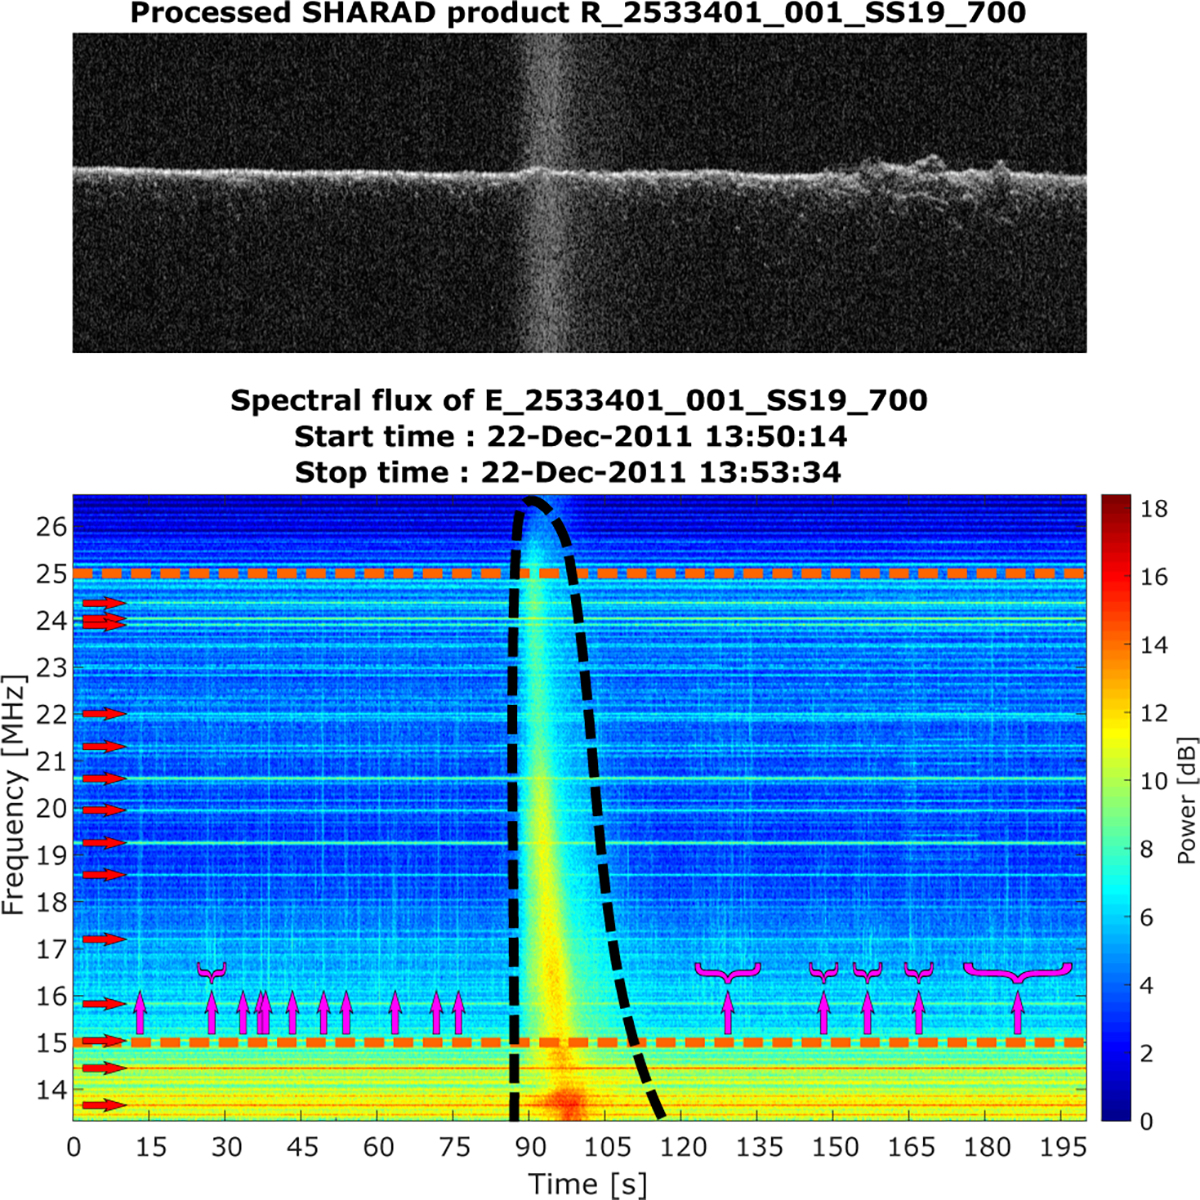
Fig. 1.
Download original image
Comparison of the Reduced Data Record (top) and spectrogram of the Experimental Data Record (bottom) for SHARAD product 2533401. Also depicted are annotations for the main signals present in the spectrogram. This product contains a type III burst (outlined by the dashed black curve); it is affected by various EMI sources, which are the narrow band signals that are persistent in time and manifest themselves as horizontal traces and the strongest of which are highlighted with horizontal arrows; and it contains traces of the reflection of the active chirp, which are wideband signals with short durations in time and manifest themselves as vertical traces, the strongest of which (or groups of which) are highlighted by vertical arrows. The band of flat spectral gain is delimited by the dashed orange lines at 15 and 25 MHz.
Current usage metrics show cumulative count of Article Views (full-text article views including HTML views, PDF and ePub downloads, according to the available data) and Abstracts Views on Vision4Press platform.
Data correspond to usage on the plateform after 2015. The current usage metrics is available 48-96 hours after online publication and is updated daily on week days.
Initial download of the metrics may take a while.