Fig. 5
Download original image
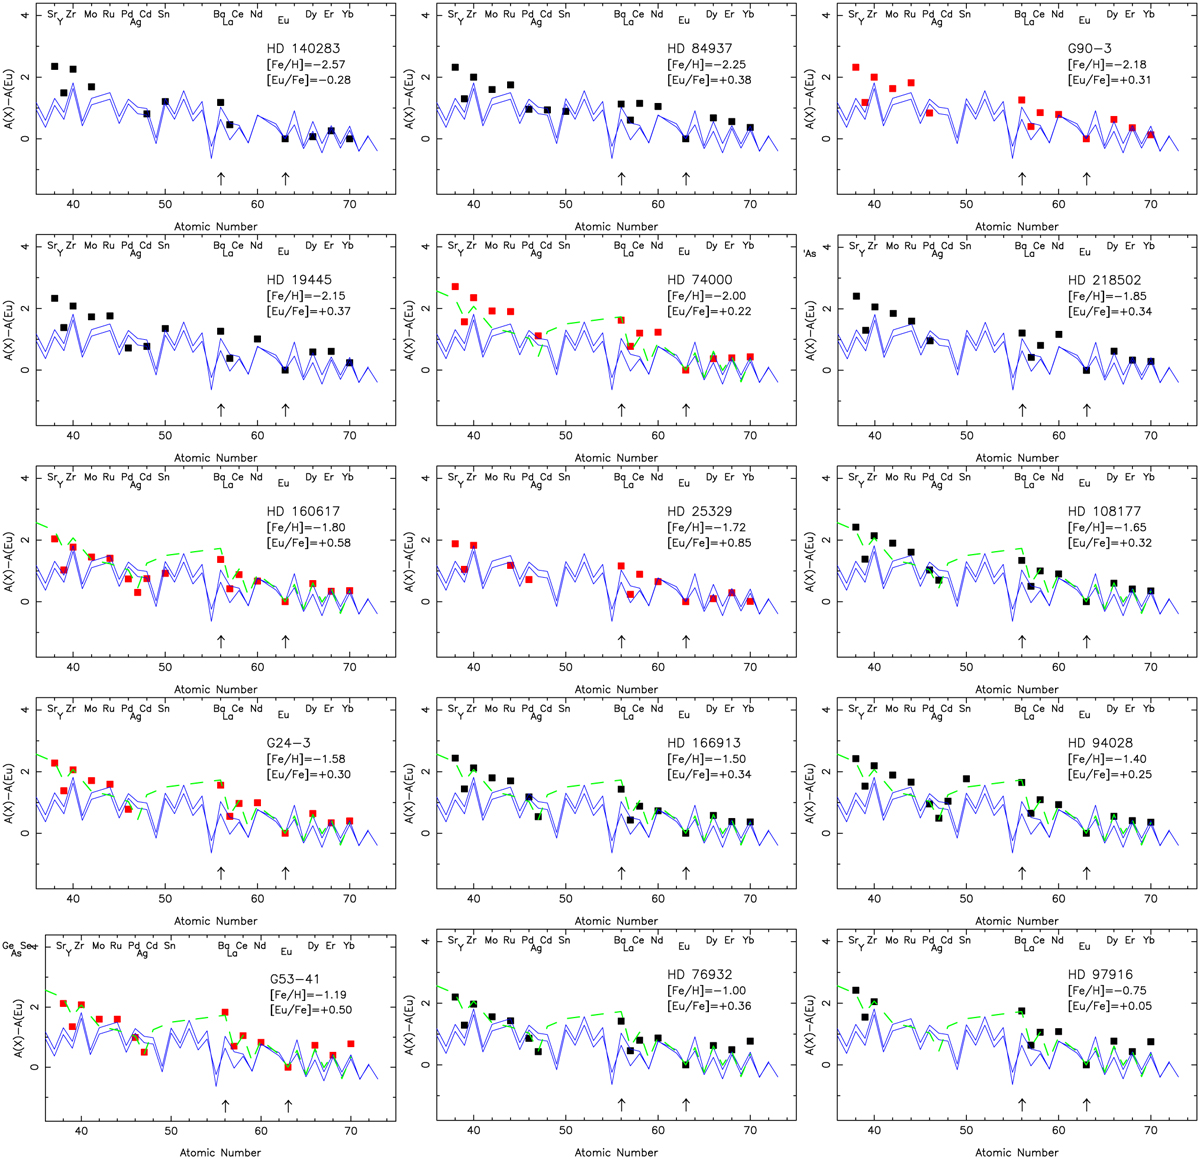
Abundance patterns of the n-capture elements observed in our sample of stars sorted by [Fe/H]. The abundances of the elements are normalised to Eu. The N-rich stars are indicated by red symbols and the normal stars by black symbols. Predictions of the main r-process following Wanajo (2007); Barbuy et al. (2011); Siqueira Mello et al. (2013, hot and cold models) are indicated by blue lines. When these predictions did not match the observations between Ru and Yb and in particular if the Ba abundance is too high compared to the Eu abundance, the solar abundance pattern (green dashed line) has been added. The position of Ba and Eu are underlined by black arrows.
Current usage metrics show cumulative count of Article Views (full-text article views including HTML views, PDF and ePub downloads, according to the available data) and Abstracts Views on Vision4Press platform.
Data correspond to usage on the plateform after 2015. The current usage metrics is available 48-96 hours after online publication and is updated daily on week days.
Initial download of the metrics may take a while.