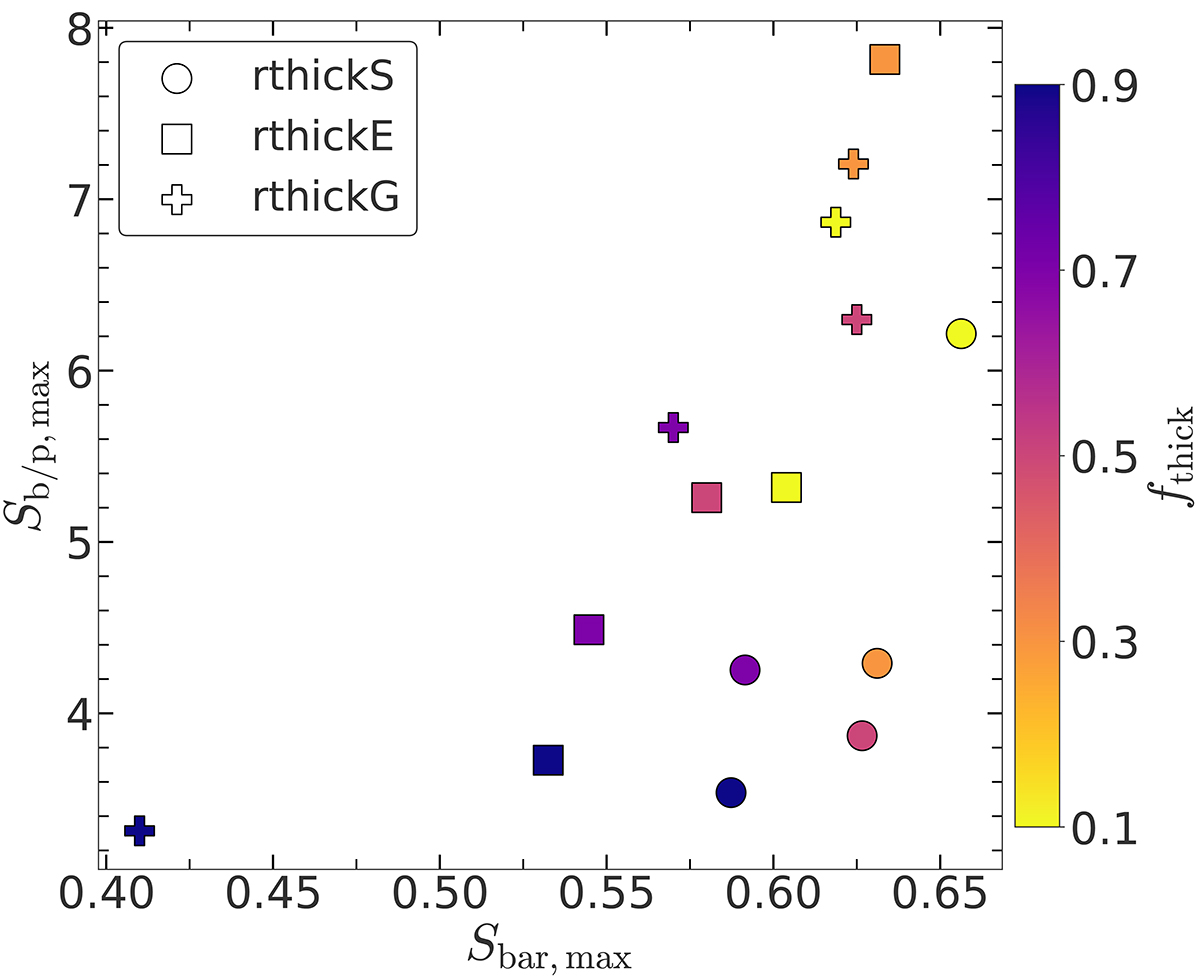
Fig. 9.
Download original image
Bar-b/p strength correlation: distribution of all thin+thick models in maximum bar strength – maximum b/p strength plane. The maximum bar strengths are taken from Ghosh et al. (2023), whereas the maximum b/p strengths are determined from Eq. (1). The colour bar denotes the thick-disc mass fraction (fthick). Different symbols represent models with different geometric configurations (see the legend). The maximum strength of the bar correlates overall with the maximum b/p strength, and this remains true for all three geometric configurations.
Current usage metrics show cumulative count of Article Views (full-text article views including HTML views, PDF and ePub downloads, according to the available data) and Abstracts Views on Vision4Press platform.
Data correspond to usage on the plateform after 2015. The current usage metrics is available 48-96 hours after online publication and is updated daily on week days.
Initial download of the metrics may take a while.