Fig. 8.
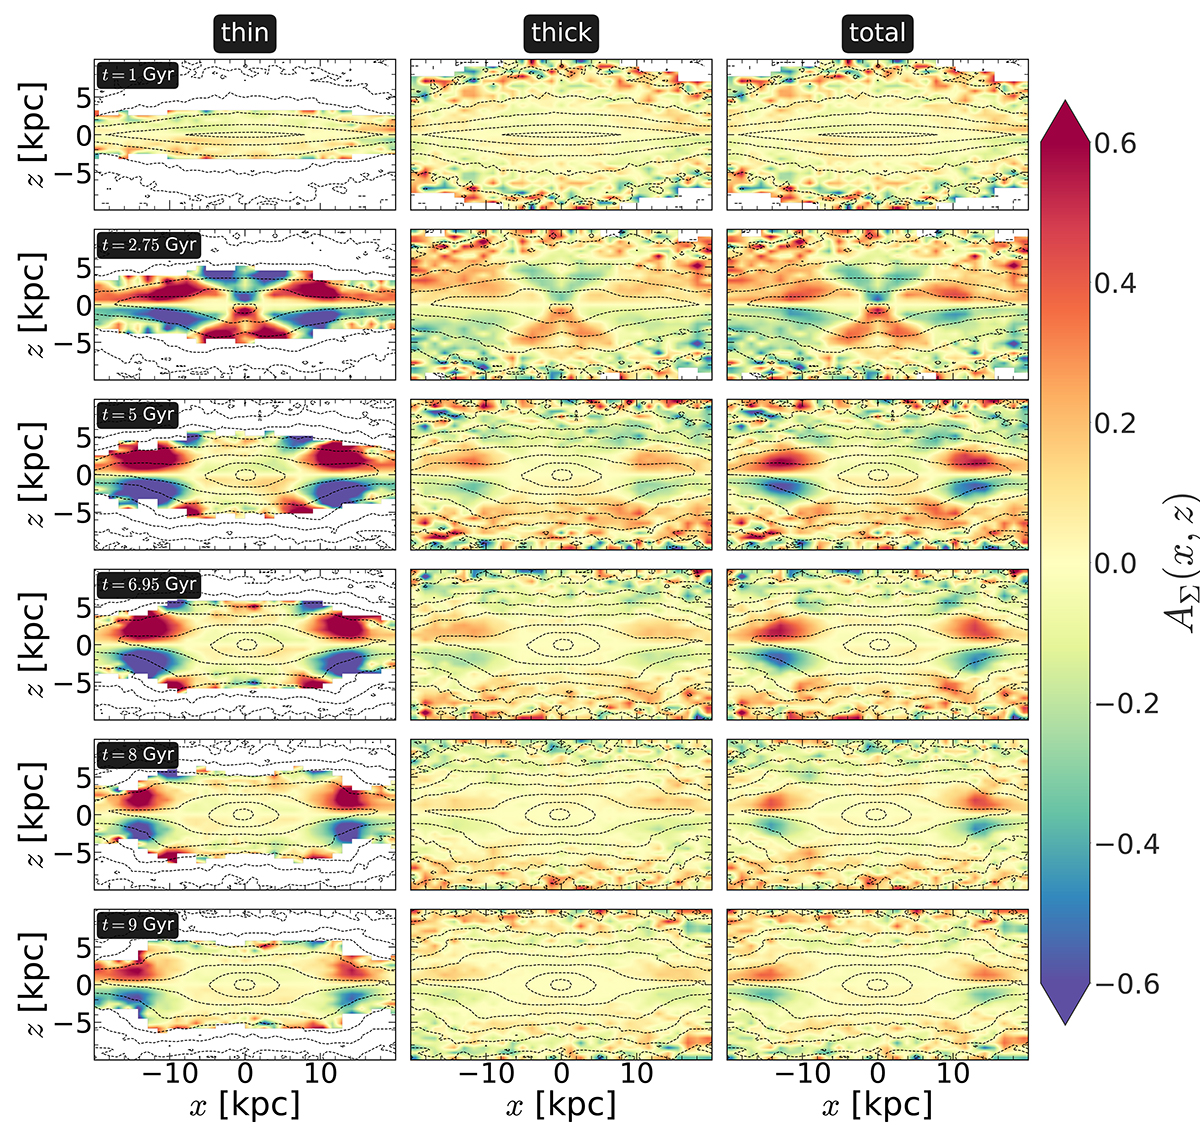
Download original image
Distribution of mid-plane asymmetry, AΣ(x, z), in the edge-on projection (x − z-plane), computed separately for the thin (left columns) and thick (middle columns) discs, as well as thin+thick (right columns) disc particles using Eq. (4) at six different times (before and after the buckling event) for the model rthickE0.5. The bar is placed along the x-axis (side-on configuration) for each time-step. Black lines denote contours of constant density. A mid-plane asymmetry persists, even long after the model has gone through the buckling phase.
Current usage metrics show cumulative count of Article Views (full-text article views including HTML views, PDF and ePub downloads, according to the available data) and Abstracts Views on Vision4Press platform.
Data correspond to usage on the plateform after 2015. The current usage metrics is available 48-96 hours after online publication and is updated daily on week days.
Initial download of the metrics may take a while.