Fig. 7.
Download original image
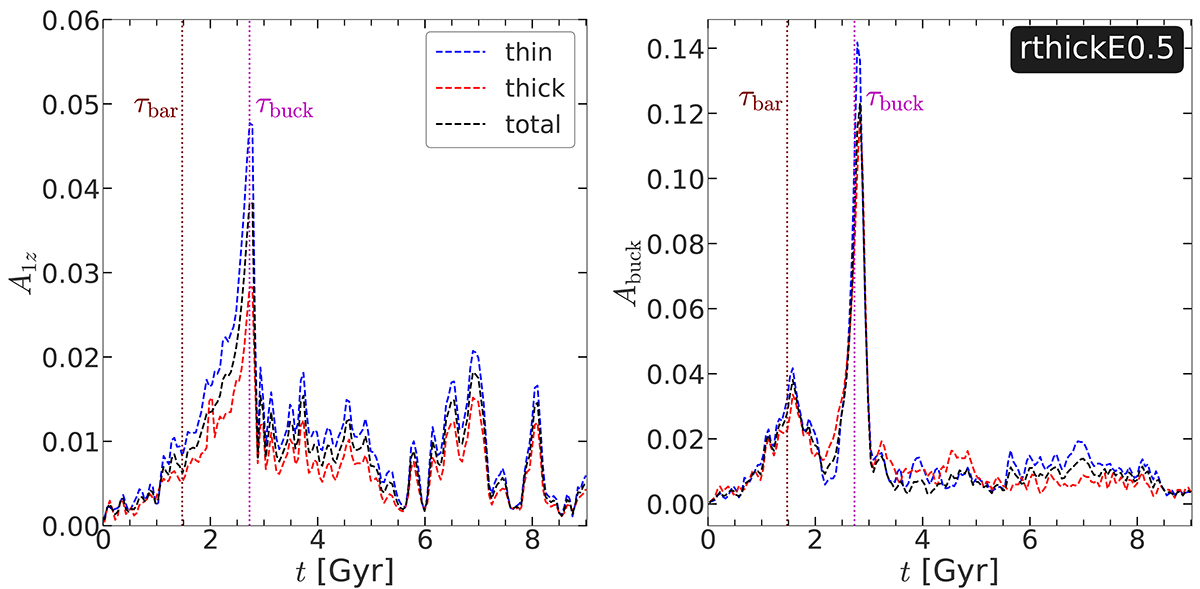
Quantifying the vertical asymmetry in thin+thick models. Left panel: temporal evolution of A1, z (Eq. (2)) denoting vertical asymmetry in bar region, calculated using thin-disc (blue lines), thick-disc (red lines), and thin+thick disc (black lines) for the model rthickE0.5. Right panel: temporal evolution of buckling amplitude, Abuck (Eq. (3)), calculated using thin-disc (blue lines), thick-disc (red lines), and thin+thick disc (black lines) for the model rthickE0.5. The vertical magenta dotted line denotes the onset of buckling instability (τbuck), calculated from the peak of Abuck profile (for details, see text). Furthermore, for reference, we indicate the onset of bar formation (τbar, vertical maroon dotted line), calculated from the amplitude of the m = 2 Fourier moment.
Current usage metrics show cumulative count of Article Views (full-text article views including HTML views, PDF and ePub downloads, according to the available data) and Abstracts Views on Vision4Press platform.
Data correspond to usage on the plateform after 2015. The current usage metrics is available 48-96 hours after online publication and is updated daily on week days.
Initial download of the metrics may take a while.