Fig. E.2.
Download original image
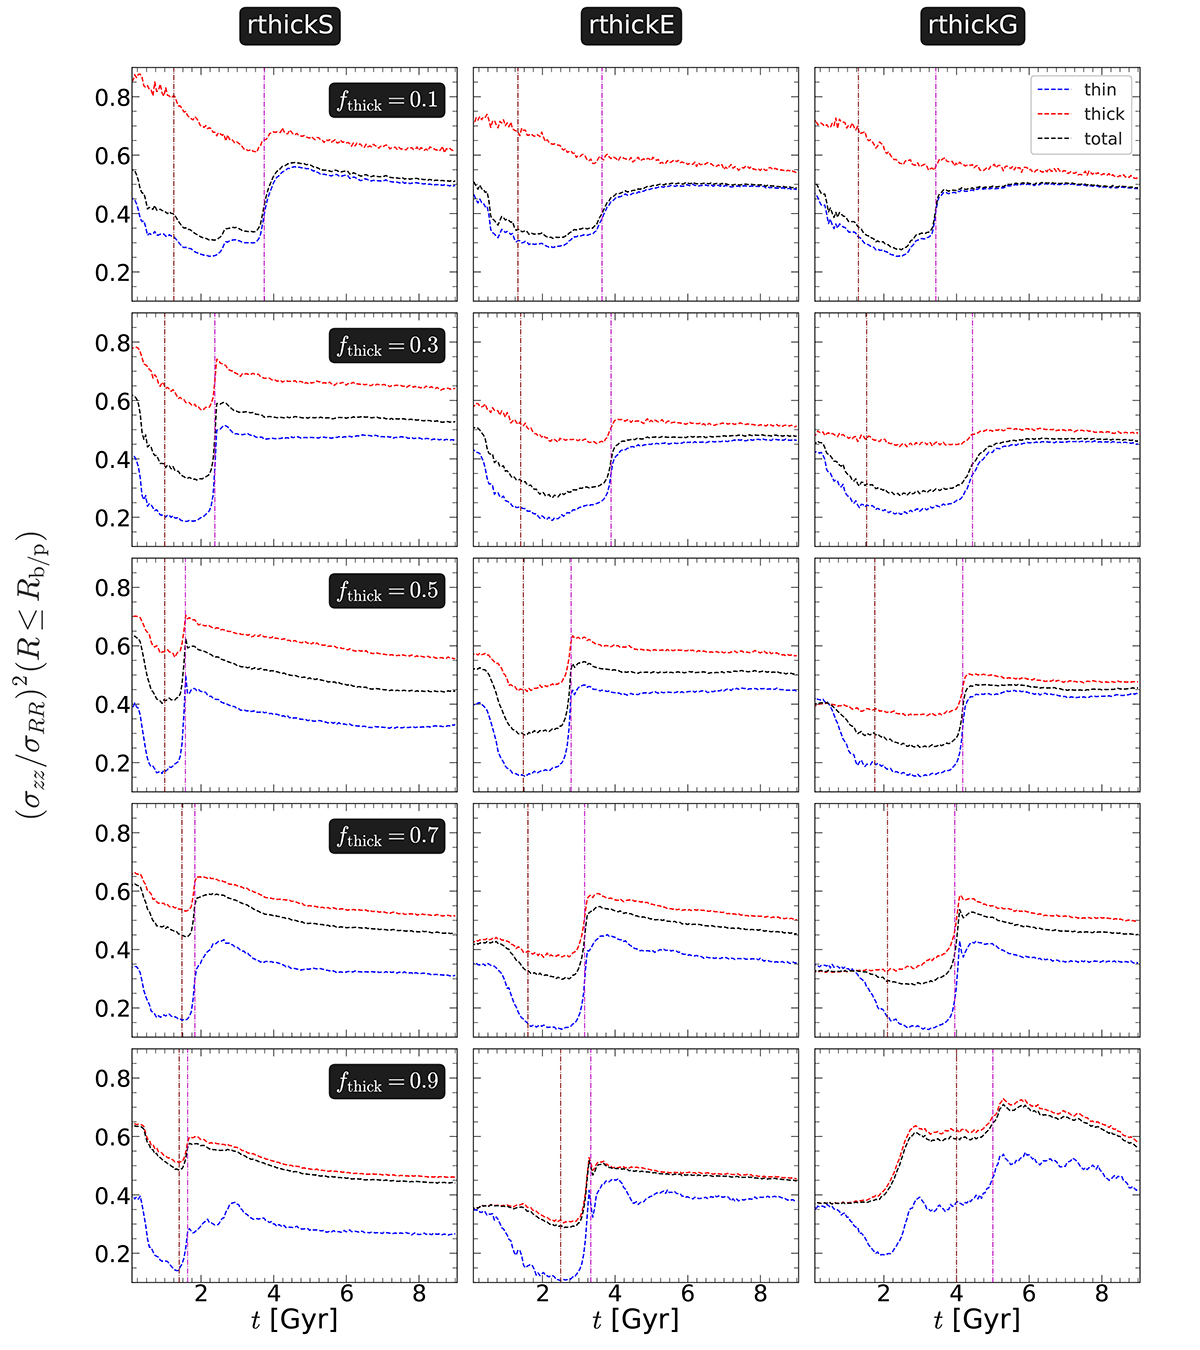
Temporal evolution of vertical-to-radial velocity dispersion (σzz/σRR) calculated within Rb/p, (σzz/σRR)2(t; R ≤ Rb/p) for thin (in blue), thick (in red), and total (thin+thick) disc (in black) particles, for all thin+thick-disc models. Left panels show the evolution for the rthickS models, whereas middle panels and right panels show the evolution for the rthickE and rthickG models, respectively. The thick-disc fraction (fthick) varies from 0.1 to 1 (top to bottom), as indicated in the left-most panel of each row. The vertical maroon dotted line denotes the onset of bar formation (τbar), while the vertical magenta dotted line denotes the onset of buckling instability (τbuck; for details, see text).
Current usage metrics show cumulative count of Article Views (full-text article views including HTML views, PDF and ePub downloads, according to the available data) and Abstracts Views on Vision4Press platform.
Data correspond to usage on the plateform after 2015. The current usage metrics is available 48-96 hours after online publication and is updated daily on week days.
Initial download of the metrics may take a while.