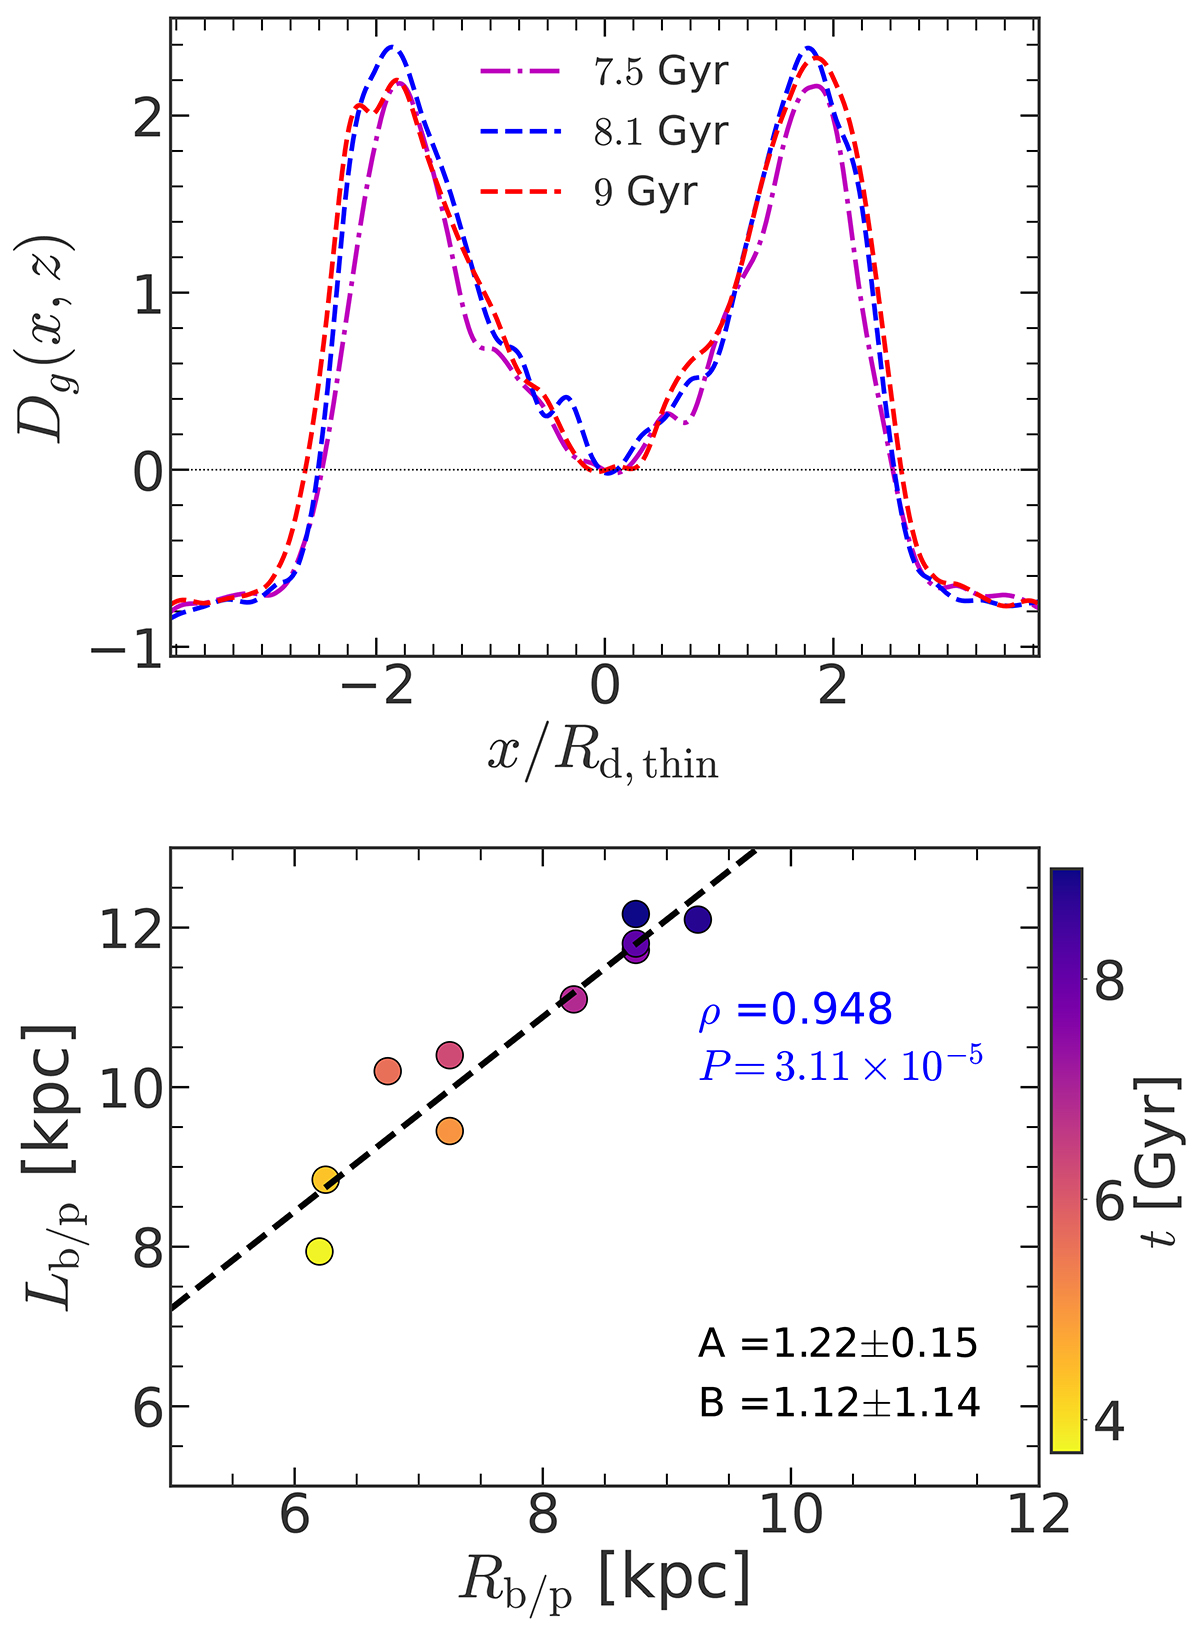
Fig. B.1.
Download original image
Comparison of different methods for measuring the b/p extent. Top panel: Profiles of function Dg(x, z) (see Eq. (B.1)), calculated at three different times for model rthickE0.5. The horizontal dotted line denotes the zeros of the function Dg(x, z) (for details, see text). Bottom panel: Correlations between size of the b/p, Lb/p and the b/p length Rb/p for the model rthickE0.5. A straight line of the form Y = AX + B is fitted (black dashed line), and the corresponding best-fit parameters are quoted. The Pearson correlation coefficients are quoted (see top right). Here, Rd, thin = 4.7 kpc.
Current usage metrics show cumulative count of Article Views (full-text article views including HTML views, PDF and ePub downloads, according to the available data) and Abstracts Views on Vision4Press platform.
Data correspond to usage on the plateform after 2015. The current usage metrics is available 48-96 hours after online publication and is updated daily on week days.
Initial download of the metrics may take a while.