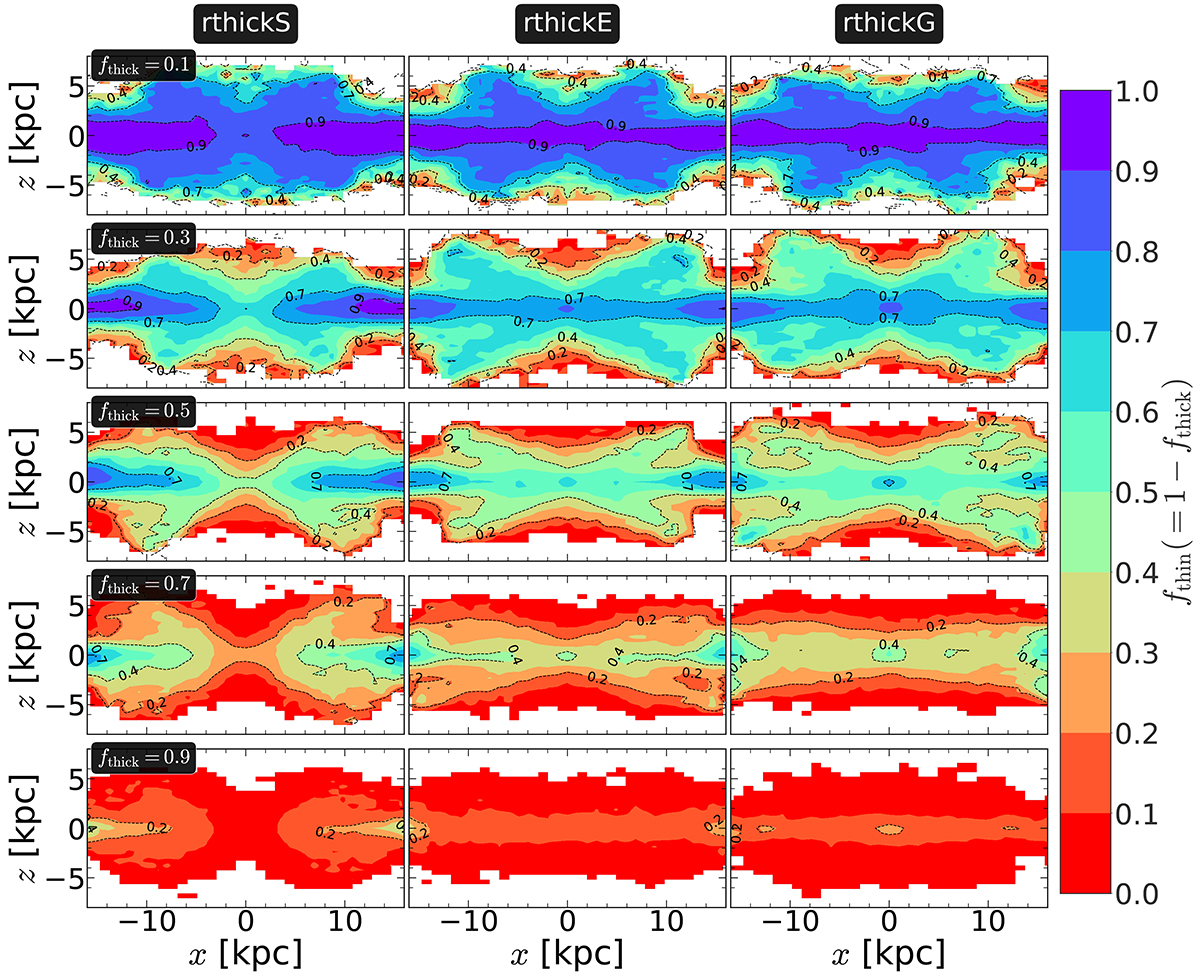
Fig. 14.
Download original image
Fraction of thin-disc stars, fthin(=1 − fthick), in the edge-on projection (with the bar placed along the x-axis) compared to the total (thin+thick) disc, at the end of the simulation run (t = 9 Gyr) for all thin+thick disc models with varying fthick values. Left panels show the distribution for the rthickS models, whereas middle panels and right panels show the distribution for the rthickE and rthickG models, respectively. The values of (fthick) vary from 0.1 to 0.9 (top to bottom), as indicated in the left-most panel of each row. For each model, the fraction of thin-disc stars decreases with height from the mid-plane (z = 0). In addition, the appearance of the b/p structure changes from more X-shaped to more boxy-shaped as the thick-disc mass fraction steadily increases.
Current usage metrics show cumulative count of Article Views (full-text article views including HTML views, PDF and ePub downloads, according to the available data) and Abstracts Views on Vision4Press platform.
Data correspond to usage on the plateform after 2015. The current usage metrics is available 48-96 hours after online publication and is updated daily on week days.
Initial download of the metrics may take a while.