Fig. 13.
Download original image
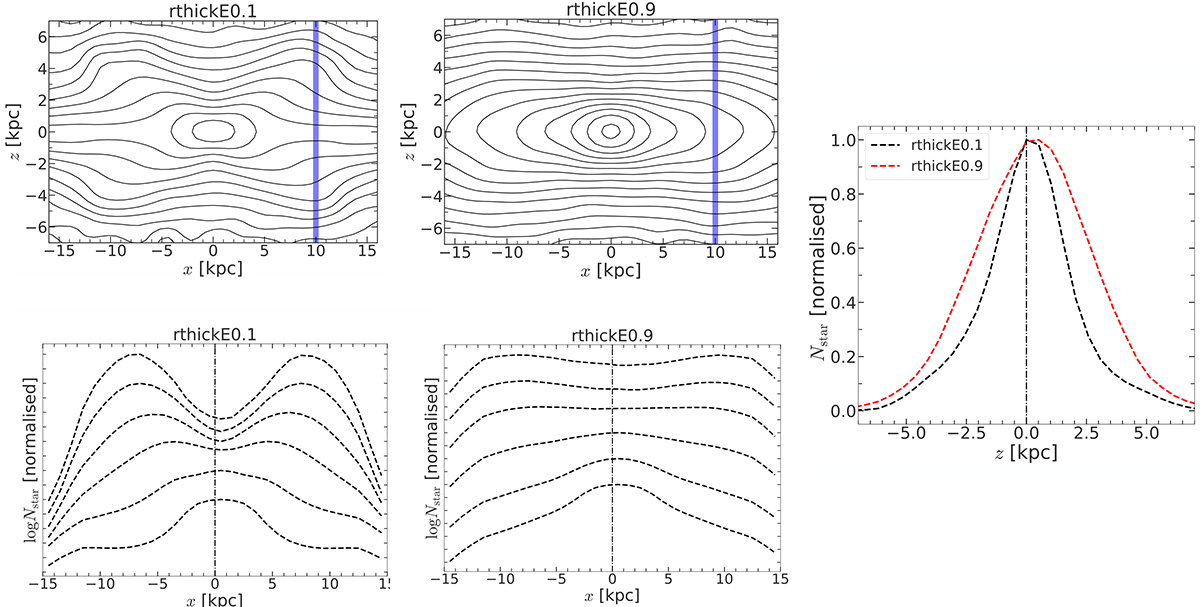
Variation of the b/p morphology with varying thick-disc mass faction (fthick). Top left panels: density contours of edge-on stellar (thin+thick) distribution (with bar placed along the x-axis) in central region at t = 9 Gyr for models rthickE0.1 and rthickE0.9. For the rthickE0.1 model, the contours display more prominent X-shaped feature, whereas for the rthickE0.9 model, the contours display more prominent box-shaped feature. Bottom left panels: density profiles (normalised by the peak density value, and in log-scale) along bar major axis, calculated at different heights (from |z| = 0 to 6 kpc, with a step-size of 1 kpc) from mid-plane, for models rthickE0.1 and rthickE0.9. The density profiles have been artificially shifted along the y-axis to show the trends as height changes, and they do not overlap. Right panel: vertical stellar density distribution (normalised by the peak density value, and in log-scale), at a radial location around peak of the b/p structure (marked by blue vertical lines in top left panels) for rthickE0.1 and rthickE0.9 models.
Current usage metrics show cumulative count of Article Views (full-text article views including HTML views, PDF and ePub downloads, according to the available data) and Abstracts Views on Vision4Press platform.
Data correspond to usage on the plateform after 2015. The current usage metrics is available 48-96 hours after online publication and is updated daily on week days.
Initial download of the metrics may take a while.