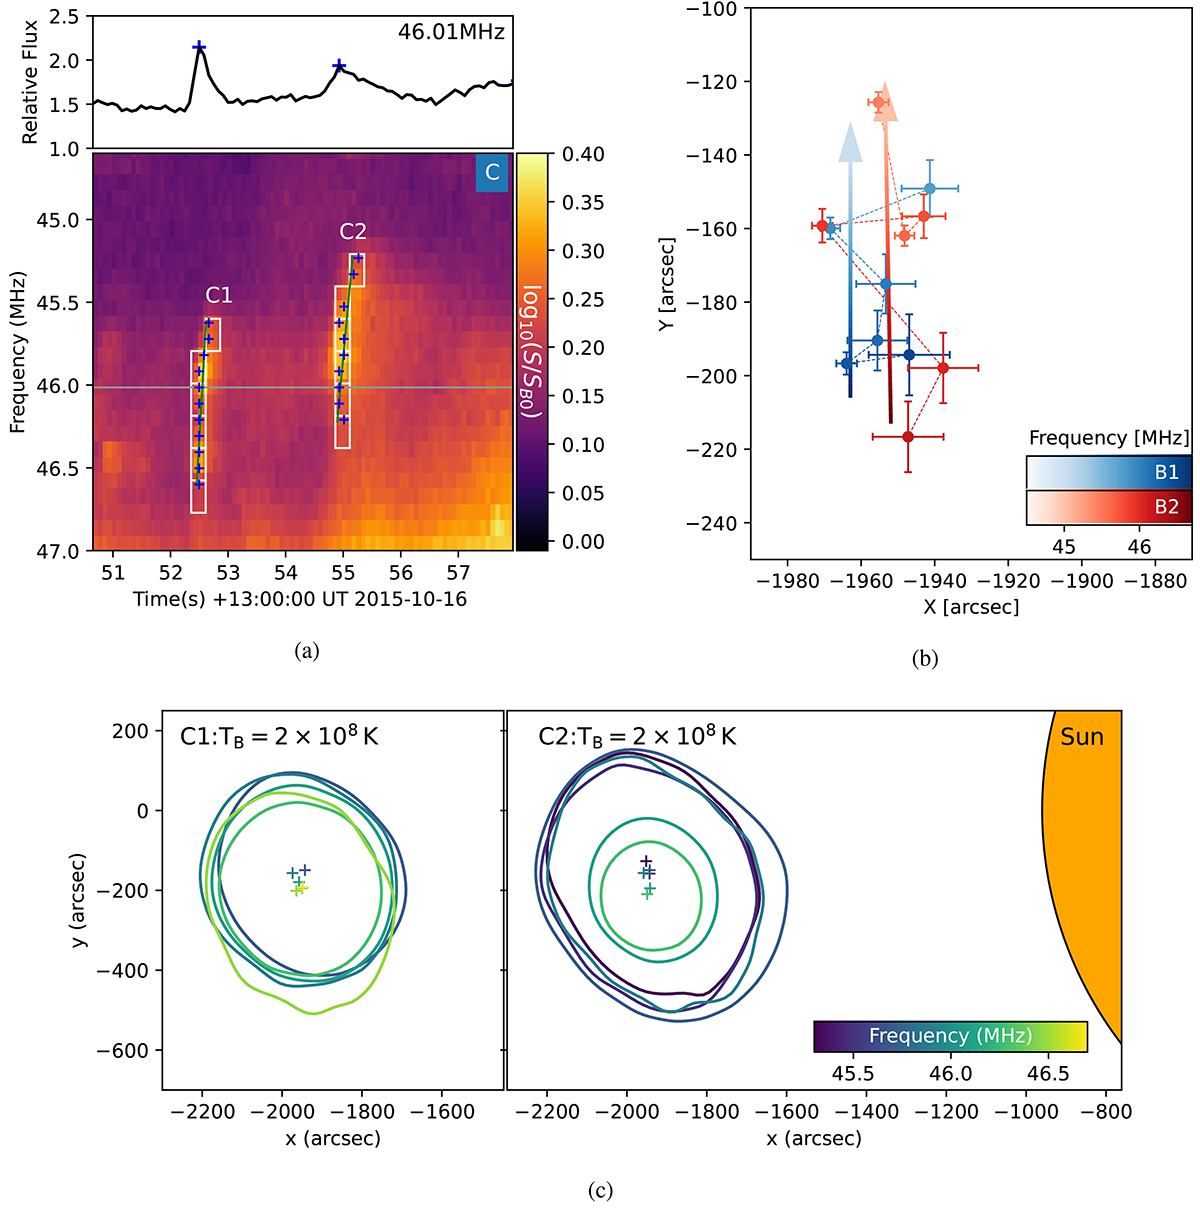
Fig. 4.
Download original image
Spectral characteristics and spatial location of herringbone group C. Panel a: dynamic spectrum of herringbone group C, consisting of two individual herringbone structures (C1 and C2). The upper panel is the 46.0 MHz flux (shown as a solid gray line in the dynamic spectrum), the blue plus sign marks the local maximum points along the herringbone, and the red plus sign marks the local maximum on the overlapped structures. The flux is in the relative unit in reference to the quiet time flux (SB0) before the burst time. The green line marks the frequency drift track of the herringbone. White rectangles mark the frequency and time integral span for the interferometric imaging. Panel b: source position of the herringbone structures in herringbone group C. We used Gaussian fitting to determine the source location. The error bar indicates the location uncertainty. Two herringbone components (C1 and C2) are presented in blue and red. The brightness of the color represents the frequency. The arrow indicates the position variation with frequency, and the dashed lines connect each point in order of frequency. Panel c: interferometric imaging of the herringbone at different frequencies. Colored solid lines indicate the brightness temperature contour at 200 MK, and the plus sign marks the peak location of the brightness temperature distribution. The time and frequency slot is marked in panel a, and snapshot images are shown in Figs. A.8 and A.9.
Current usage metrics show cumulative count of Article Views (full-text article views including HTML views, PDF and ePub downloads, according to the available data) and Abstracts Views on Vision4Press platform.
Data correspond to usage on the plateform after 2015. The current usage metrics is available 48-96 hours after online publication and is updated daily on week days.
Initial download of the metrics may take a while.