Fig. 1.
Download original image
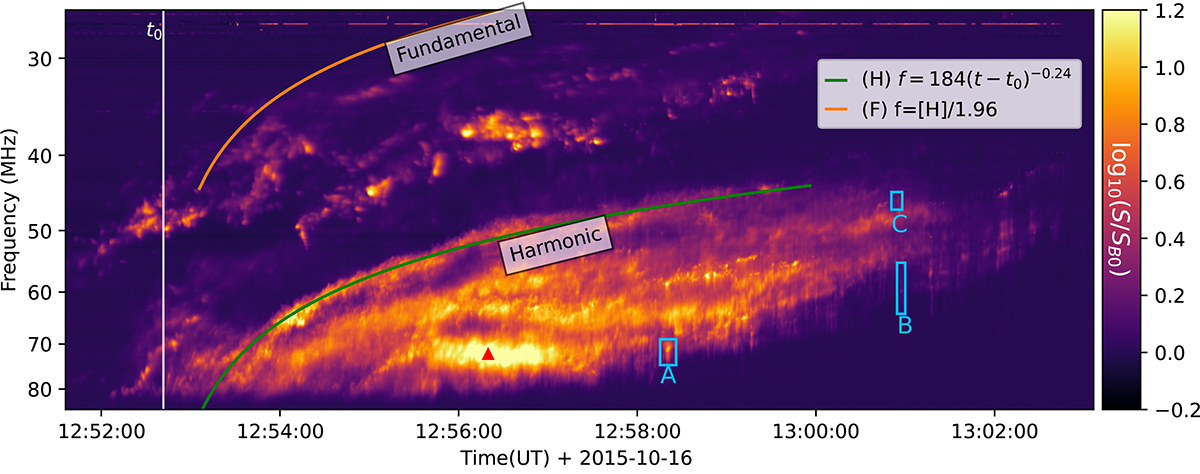
Dynamic spectrum of the type II radio burst. The flux is normalized according to the quiet time flux (SB0), which represents the relative flux in reference to the quiet Sun. The fitted leading edge of the harmonic part of this type II is shown as solid green lines, and the solid orange line indicates the leading edge of the fundamental emission, derived from multiplying the radio of F/H = 1/1.96. Three herringbone groups are shown with blue boxes and labeled A, B, and C. The brightest time-frequency point is marked as a red triangle.
Current usage metrics show cumulative count of Article Views (full-text article views including HTML views, PDF and ePub downloads, according to the available data) and Abstracts Views on Vision4Press platform.
Data correspond to usage on the plateform after 2015. The current usage metrics is available 48-96 hours after online publication and is updated daily on week days.
Initial download of the metrics may take a while.