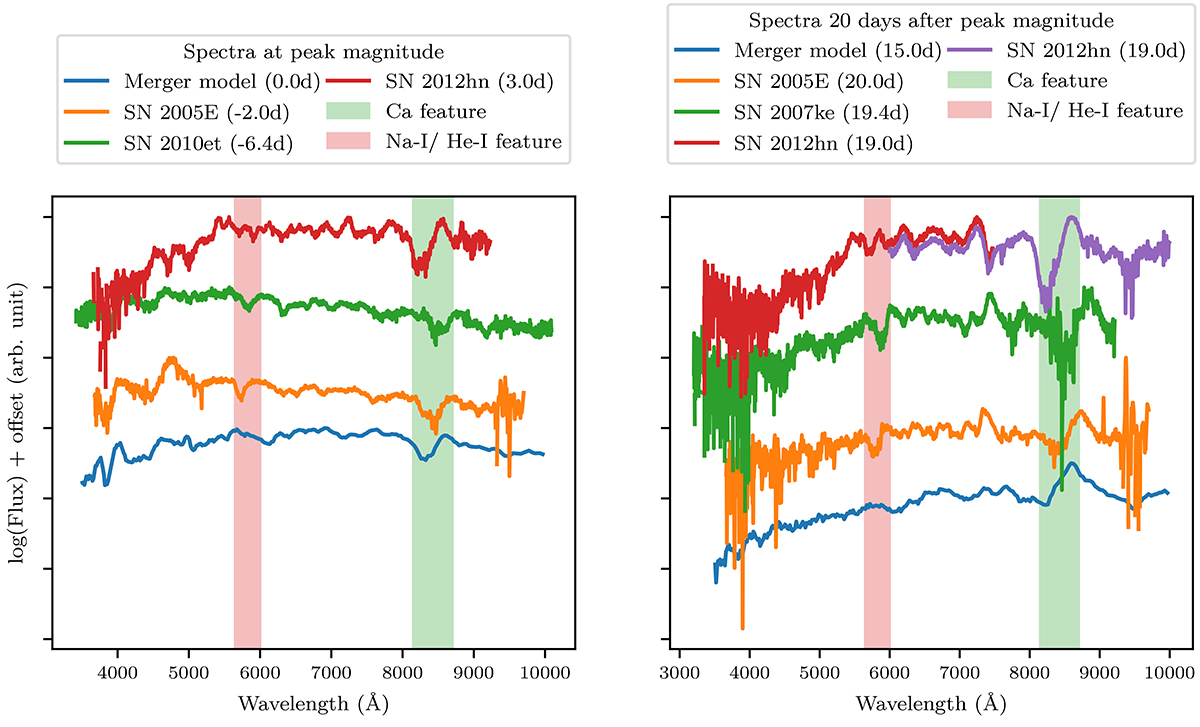
Fig. 4.
Download original image
Spectral comparison between our merger model and various Ca-rich transient candidates (Perets et al. 2010; Kasliwal et al. 2012; Valenti et al. 2014; Shivvers et al. 2019). The prominent calcium feature (green marking) and the poorly reproduced Na-I/He-I feature (red marking) can be seen. It should be noted that these markings do not indicate the precise location of the respective features, but rather serve as a guide for the eye. All data are from WISeREP (Yaron & Gal-Yam 2012). Left: spectra around peak magnitude. Right: spectra ∼20 days after peak magnitude.
Current usage metrics show cumulative count of Article Views (full-text article views including HTML views, PDF and ePub downloads, according to the available data) and Abstracts Views on Vision4Press platform.
Data correspond to usage on the plateform after 2015. The current usage metrics is available 48-96 hours after online publication and is updated daily on week days.
Initial download of the metrics may take a while.