Open Access
Fig. 3.
Download original image
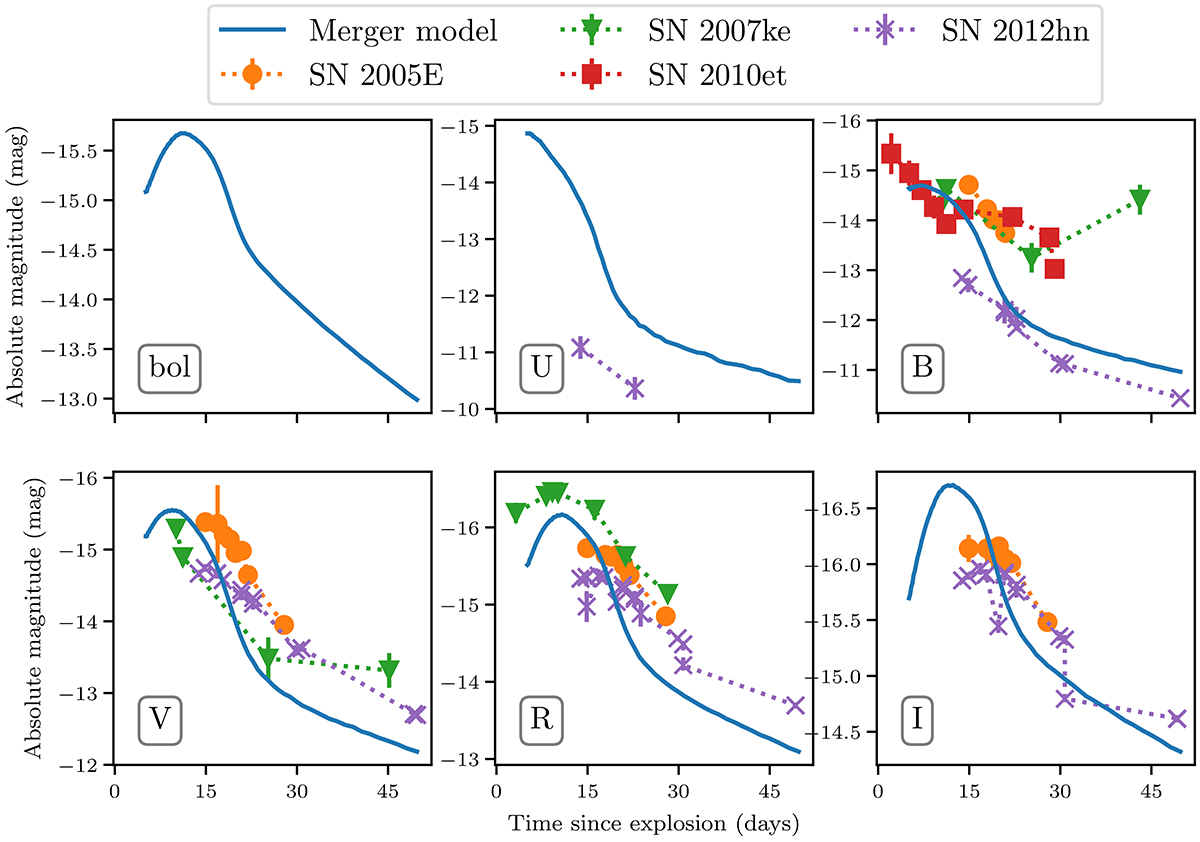
Bolometric and broadband light curves of the merger model. Several Ca-rich transient candidates are plotted as well for comparison: SN 2005E Perets et al. (2010), SN 2007ke, SN 2010et Kasliwal et al. (2012), and SN 2012hn Valenti et al. (2014). All data are taken from the Open Supernova Catalog (Guillochon et al. 2017).
Current usage metrics show cumulative count of Article Views (full-text article views including HTML views, PDF and ePub downloads, according to the available data) and Abstracts Views on Vision4Press platform.
Data correspond to usage on the plateform after 2015. The current usage metrics is available 48-96 hours after online publication and is updated daily on week days.
Initial download of the metrics may take a while.