Fig. 9
Download original image
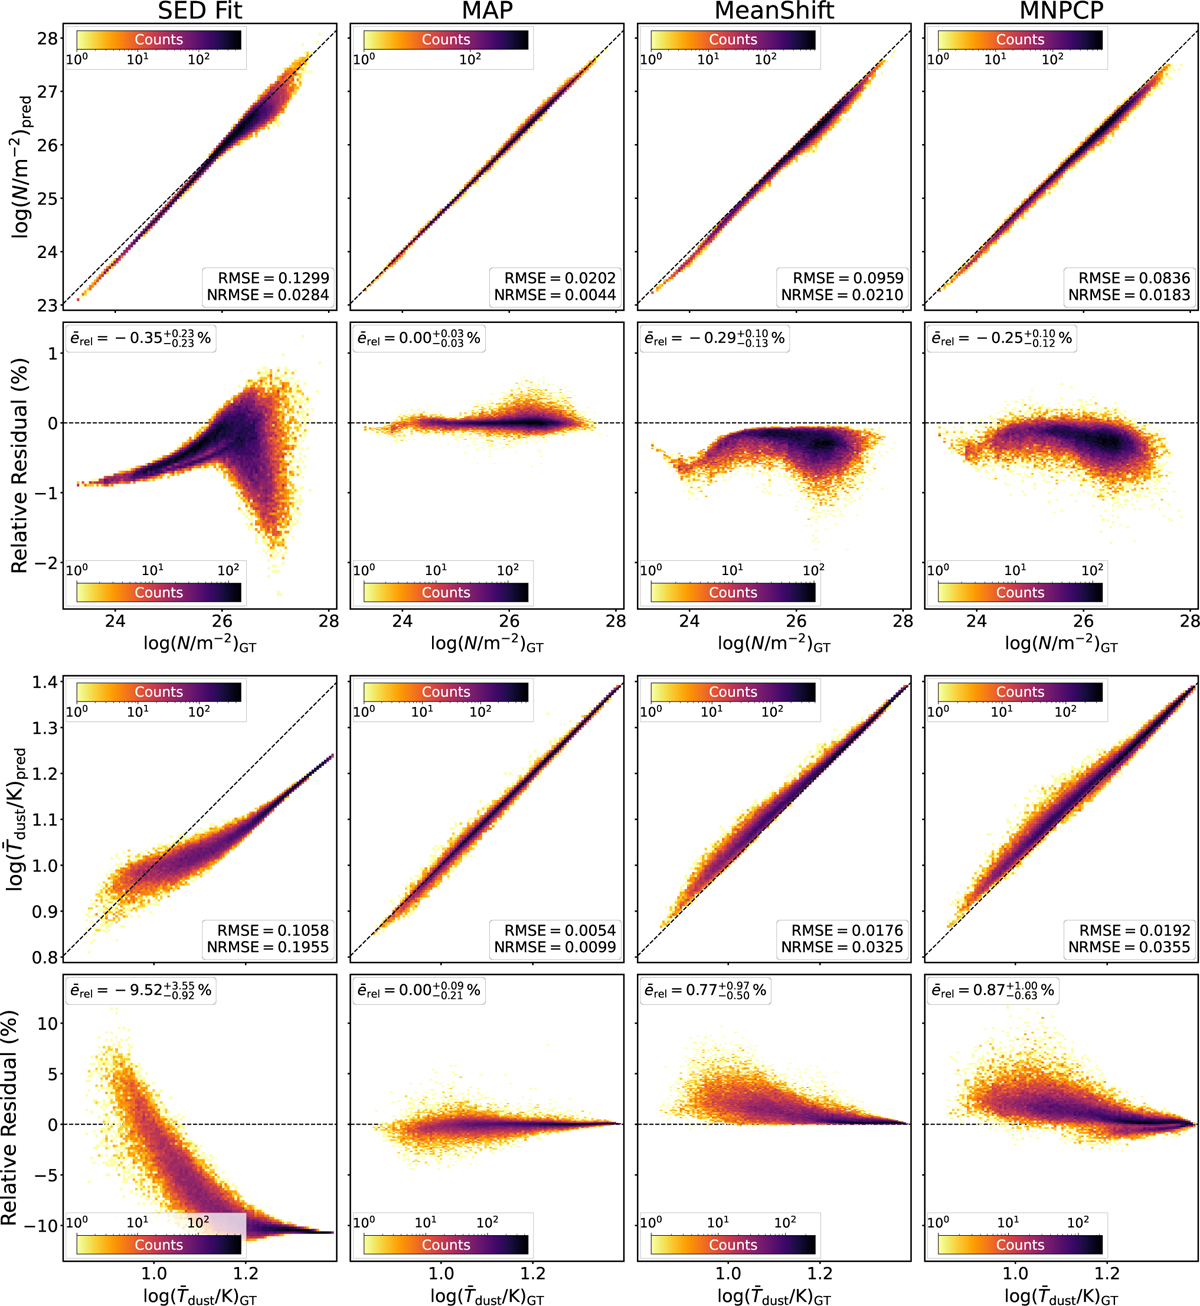
Comparison of the predictive performance for column density and density averaged temperature between a classical SED fitting technique and our cINN approach across all pixels of the 50 test cubes that are only subject to the ISRF. The top two rows show the results for the estimated column density, whereas the bottom two present the density averaged dust temperature, ![]() . In each group, the upper panels provide a direct one-to-one comparison of the predicted values to the respective ground truth, whereas the lower panels show the corresponding relative residuals.
. In each group, the upper panels provide a direct one-to-one comparison of the predicted values to the respective ground truth, whereas the lower panels show the corresponding relative residuals.
Current usage metrics show cumulative count of Article Views (full-text article views including HTML views, PDF and ePub downloads, according to the available data) and Abstracts Views on Vision4Press platform.
Data correspond to usage on the plateform after 2015. The current usage metrics is available 48-96 hours after online publication and is updated daily on week days.
Initial download of the metrics may take a while.