Fig. 8
Download original image
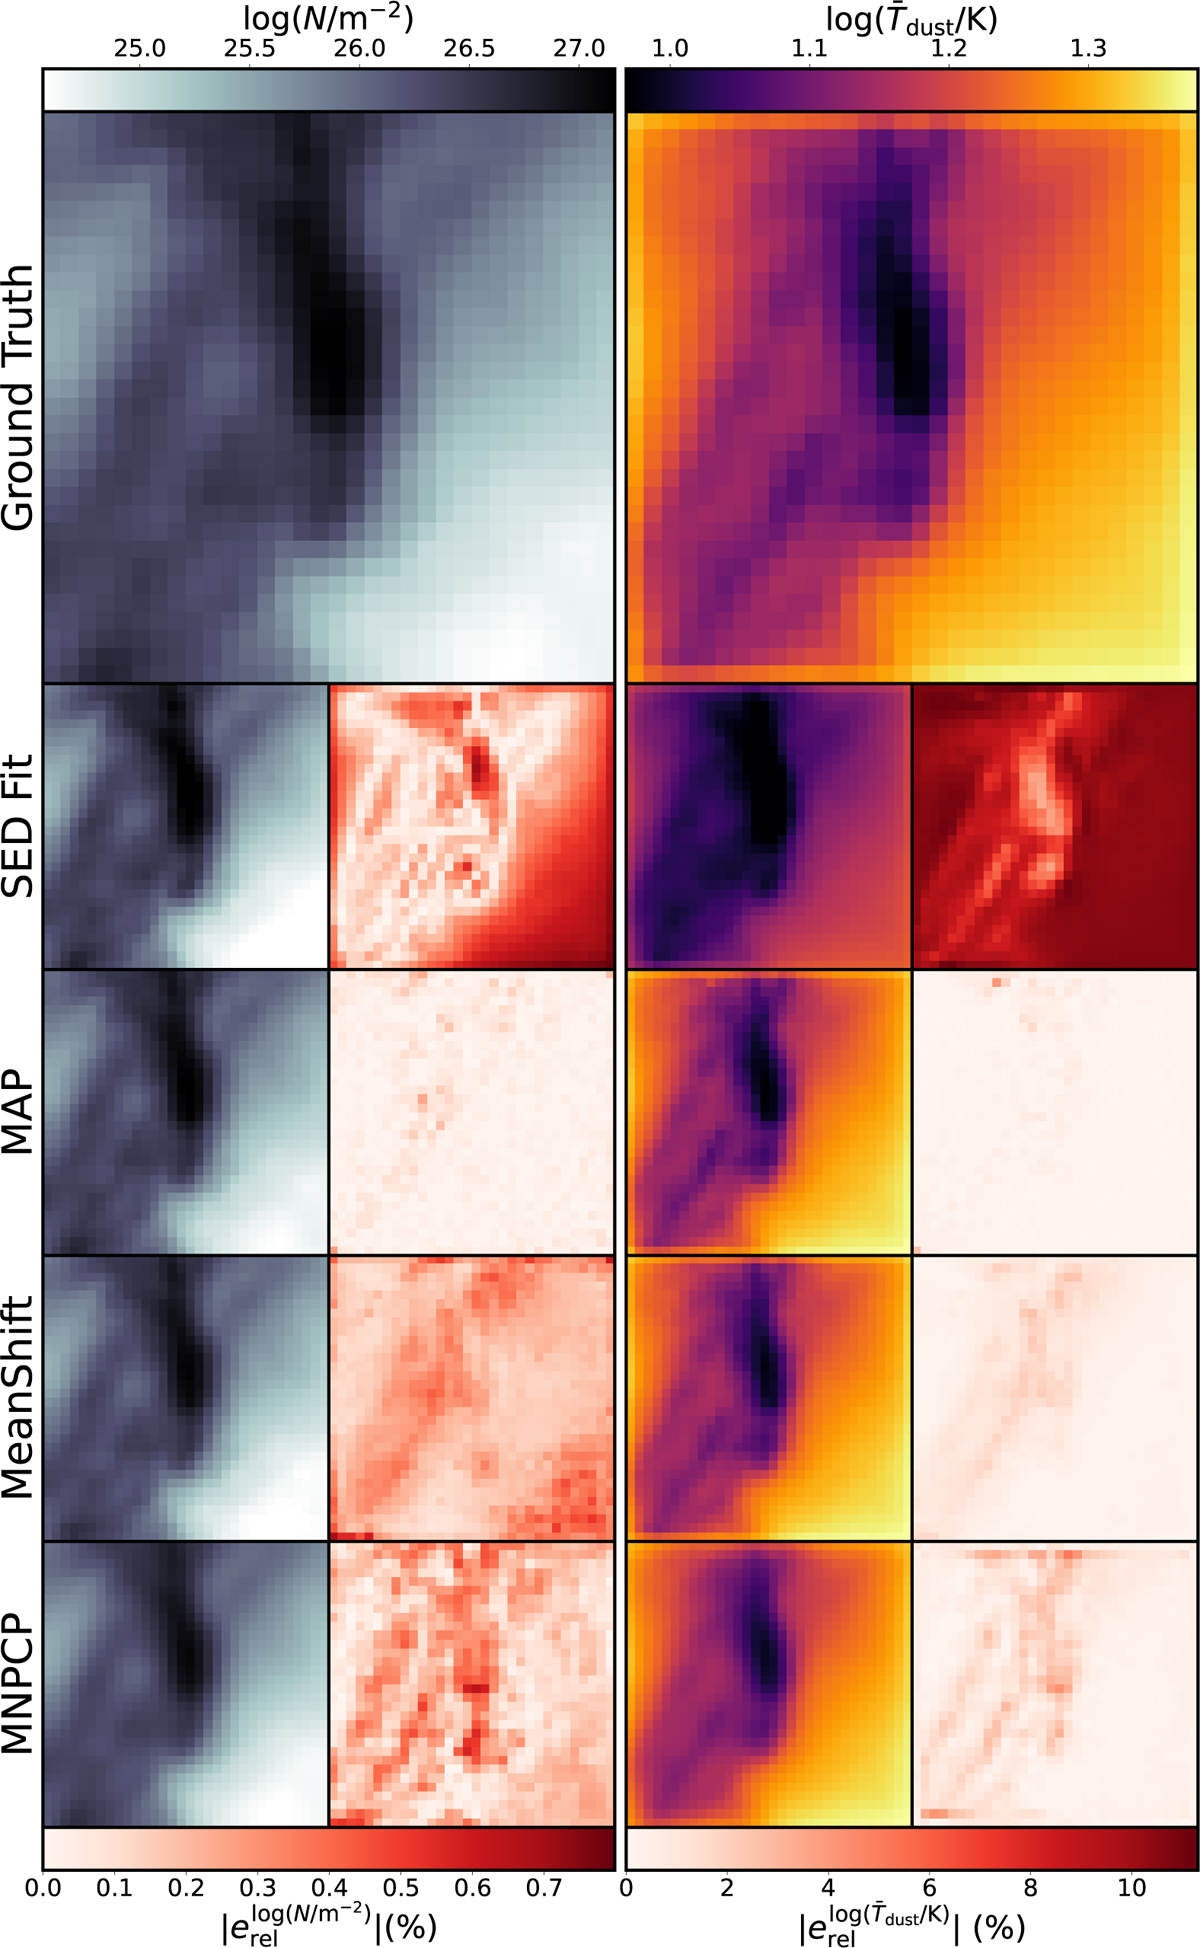
Comparison of estimated column density and average temperature maps for one example cube in the ISRF-only RT configuration between a classical SED fit and our cINN approach. The large panels on the top show the ground truth for the column density (left) and density weighted average temperature (right), respectively. The smaller panels below each ground truth panel present a map of the estimates from the respective method on the left and a map of the absolute relative error |erel| on the right. The example cube as in Figs. 3, B.1, and B.2 is shown.
Current usage metrics show cumulative count of Article Views (full-text article views including HTML views, PDF and ePub downloads, according to the available data) and Abstracts Views on Vision4Press platform.
Data correspond to usage on the plateform after 2015. The current usage metrics is available 48-96 hours after online publication and is updated daily on week days.
Initial download of the metrics may take a while.