Fig. 5
Download original image
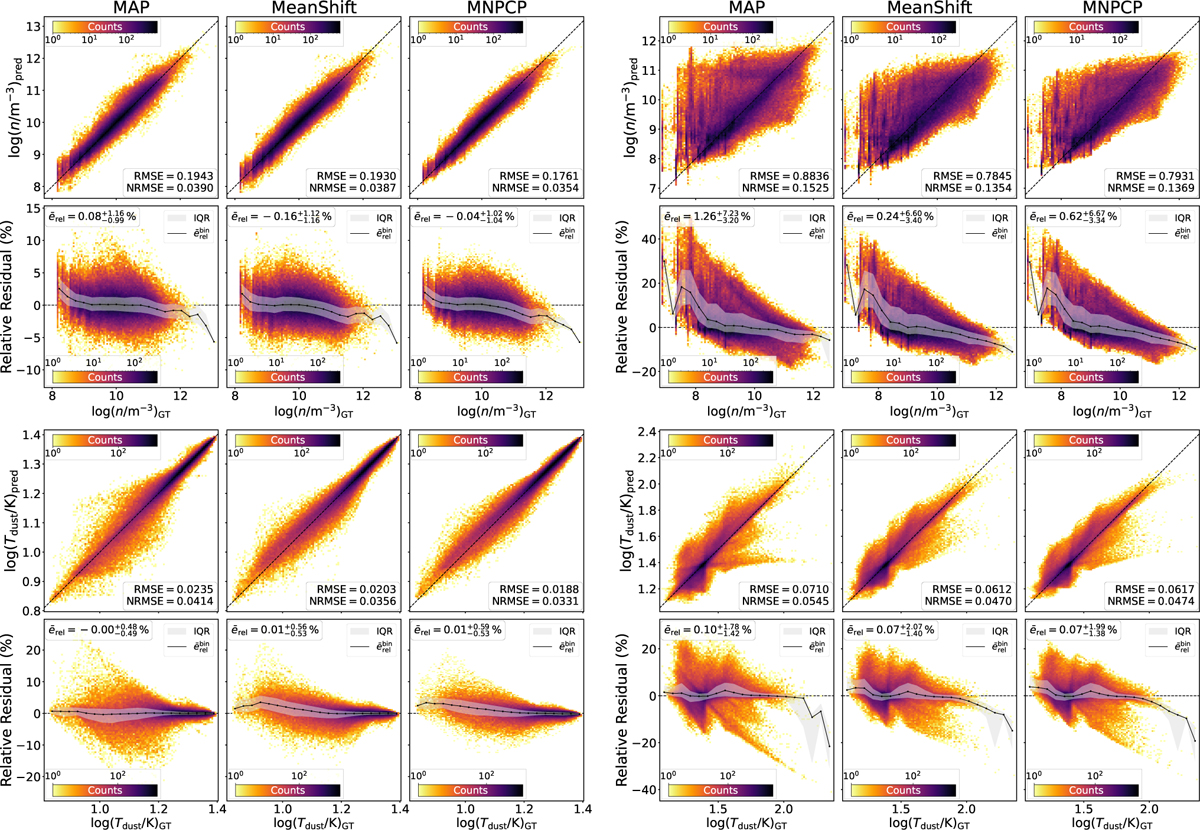
Breakdown of the predictive performance of the SLoS-cINN for the best and worst cases. Analogously to Fig. 4, we show the 2D histograms for the one-to-one comparison of the prediction results (rows one and three) and their respective residuals (rows 2 and 4). The left three columns present the five best reconstructed cubes, whereas the five worst reconstructed ones are shown in the three right columns, respectively.
Current usage metrics show cumulative count of Article Views (full-text article views including HTML views, PDF and ePub downloads, according to the available data) and Abstracts Views on Vision4Press platform.
Data correspond to usage on the plateform after 2015. The current usage metrics is available 48-96 hours after online publication and is updated daily on week days.
Initial download of the metrics may take a while.